

Question: 9. Each of the following graphs represents the derivative function f' (x) of a function f(x). Determine i. the intervals where f(x) is increasing ii.

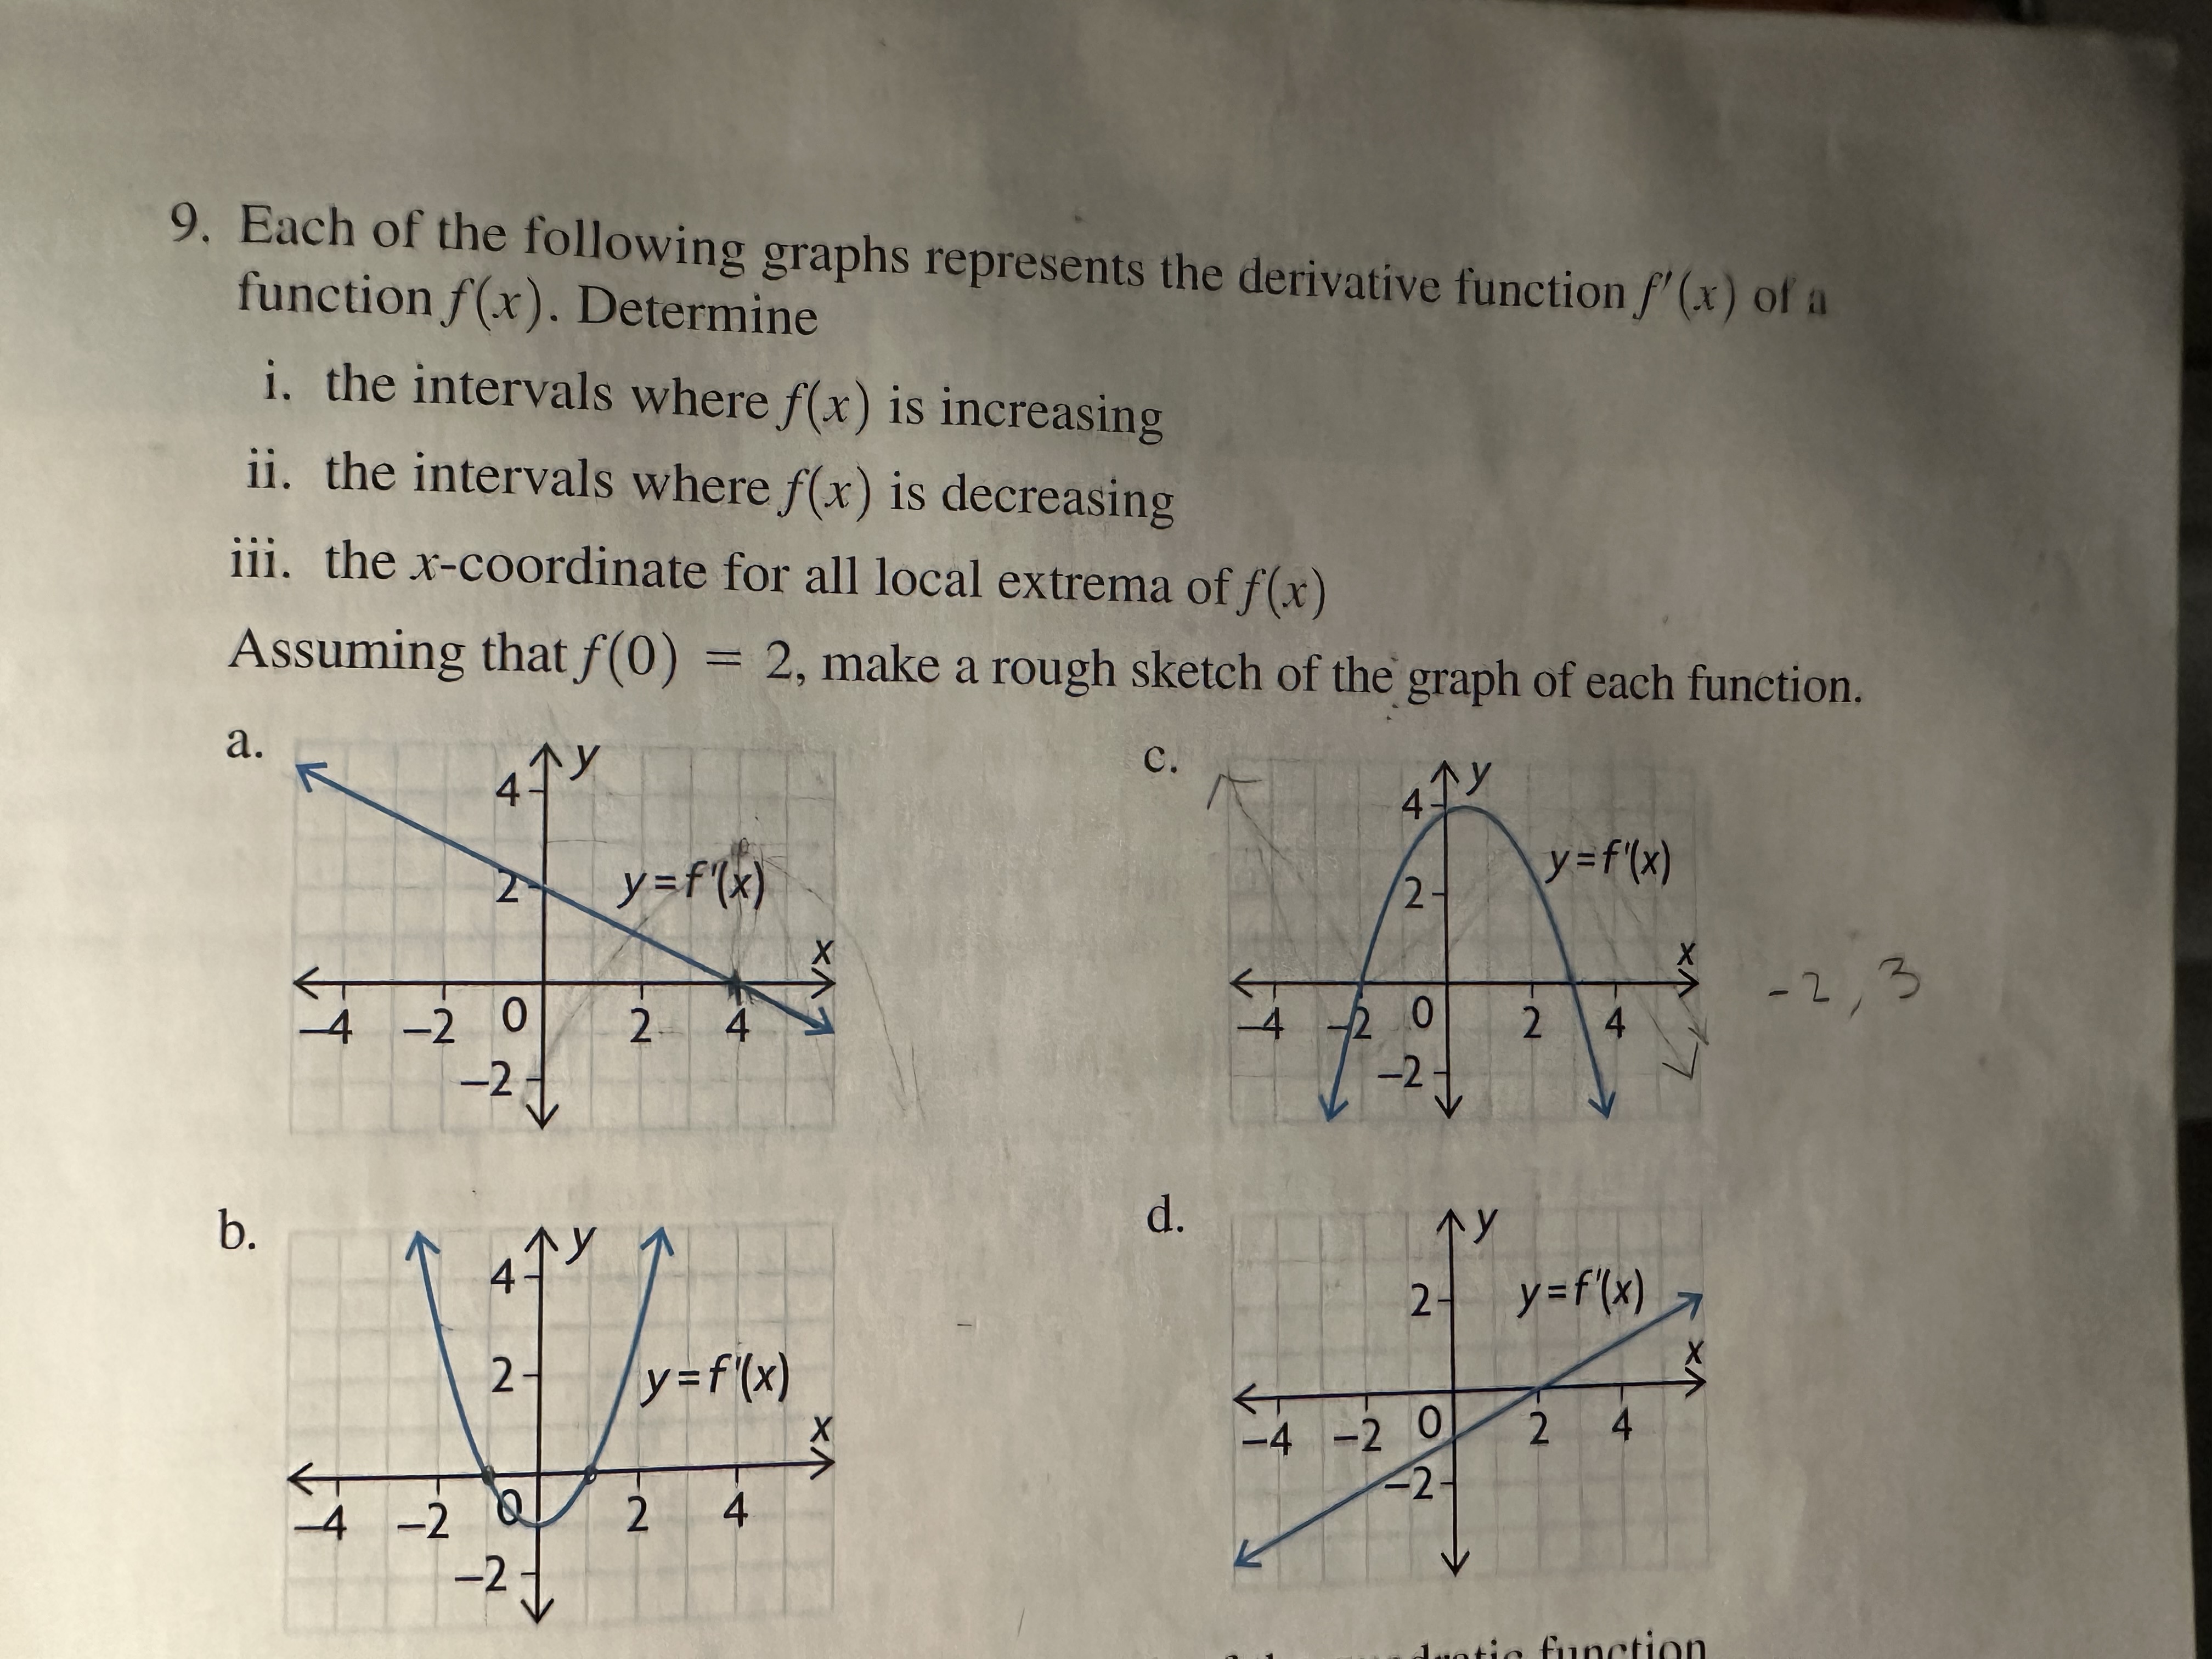
9. Each of the following graphs represents the derivative function f' (x) of a function f(x). Determine i. the intervals where f(x) is increasing ii. the intervals where f(x) is decreasing iii. the x-coordinate for all local extrema of f(x) Assuming that f(0) = 2, make a rough sketch of the graph of each function. a. C . y=f (x ) 2- y =f'(x) 4 - 2 0 2 4 VX 2 - 2 , 3 4 b. d. 2- y=f'(x) y = f'(x) VX VX -4 -2 0 2 4 - 2 Q 4 -2
Step by Step Solution
There are 3 Steps involved in it
1 Expert Approved Answer
Step: 1 Unlock

Question Has Been Solved by an Expert!
Get step-by-step solutions from verified subject matter experts
Step: 2 Unlock
Step: 3 Unlock