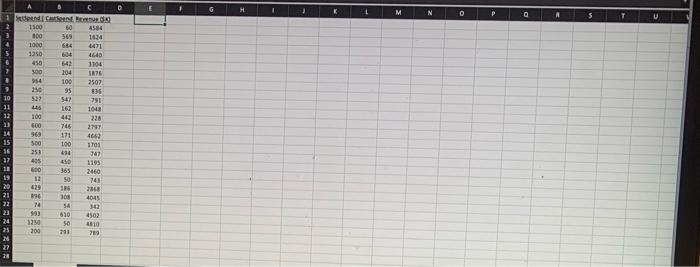
Question: 9 H 1 M N 0 P D A 1 den 1500 09 DOU 4584 1834 4471 4640 1104 569 624 604 542 204 100

9 H 1 M N 0 P D A 1 den 1500 09 DOU 4584 1834
9 H 1 M N 0 P D A 1 den 1500 09 DOU 4584 1834 4471 4640 1104 569 624 604 542 204 100 95 547 162 442 746 171 1000 1250 450 300 954 10 522 445 100 600 969 500 253 405 COSE SER 162 9 10 11 12 13 14 15 16 17 11 13 20 21 22 23 24 001 1043 220 2707 4662 1701 747 1195 2460 741 3858 4045 430 410 365 50 15 10 54 009 FU 029 396 14 993 320 200 ote 50 4502 4110 29 18 points in total] One of the great unanswered questions in the entertainment industry is: "What really makes a TV show a hit in an attempt to shed some light on this, data were collected on a random sample of television shows that ran in the US. In 2019. The data is available in the Final.xlsx"Excel file. Use this data to answer questions 29 to 33 The variables are defined as Setigend. The amount, in thousands of dollars per week spent on the physical set where the show is taped background, props, landscaping lighting wardrobes etc. CastSpend: The amount, in thousands of dollars per week, spent on salaries for the actors in the show. Revenue: Weekly revenues, in thousands of dollars, from advertising earned by that show. This is the dependent variable. Estimate Ravenue as a function of all 2 variables:SetSpend. CastSpend. Call this "Model All-2". In Model All-Z. (Write up to 3 decimal values in the space provided below) a. [1 points What is the estimated intercept? b. [1 point What is the estimated slope of SetSpend? c. 1 point] What is the p value of the estimated slope of SetSpend? d. 11 point! What is the estimated slope of CastSpend? e. It points What is that p value of the estimated slope of CastSpend? 11 points What is the Adjusted of the model) g 11 point? What is the standard error of estimates? n. 1 point What is the p value of the Fest? 9 H 1 M N 0 P D A 1 den 1500 09 DOU 4584 1834 4471 4640 1104 569 624 604 542 204 100 95 547 162 442 746 171 1000 1250 450 300 954 10 522 445 100 600 969 500 253 405 COSE SER 162 9 10 11 12 13 14 15 16 17 11 13 20 21 22 23 24 001 1043 220 2707 4662 1701 747 1195 2460 741 3858 4045 430 410 365 50 15 10 54 009 FU 029 396 14 993 320 200 ote 50 4502 4110 29 18 points in total] One of the great unanswered questions in the entertainment industry is: "What really makes a TV show a hit in an attempt to shed some light on this, data were collected on a random sample of television shows that ran in the US. In 2019. The data is available in the Final.xlsx"Excel file. Use this data to answer questions 29 to 33 The variables are defined as Setigend. The amount, in thousands of dollars per week spent on the physical set where the show is taped background, props, landscaping lighting wardrobes etc. CastSpend: The amount, in thousands of dollars per week, spent on salaries for the actors in the show. Revenue: Weekly revenues, in thousands of dollars, from advertising earned by that show. This is the dependent variable. Estimate Ravenue as a function of all 2 variables:SetSpend. CastSpend. Call this "Model All-2". In Model All-Z. (Write up to 3 decimal values in the space provided below) a. [1 points What is the estimated intercept? b. [1 point What is the estimated slope of SetSpend? c. 1 point] What is the p value of the estimated slope of SetSpend? d. 11 point! What is the estimated slope of CastSpend? e. It points What is that p value of the estimated slope of CastSpend? 11 points What is the Adjusted of the model) g 11 point? What is the standard error of estimates? n. 1 point What is the p value of the Fest

Step by Step Solution

There are 3 Steps involved in it

1 Expert Approved Answer
Step: 1 Unlock blur-text-image
Question Has Been Solved by an Expert!

Get step-by-step solutions from verified subject matter experts

Step: 2 Unlock
Step: 3 Unlock

Students Have Also Explored These Related General Management Questions!