

Question: 9) Here is the residual data. Plot the residual data on the graph. 3 1 4 -.2 5 7 -3.5 .9 2 8 2.1 6
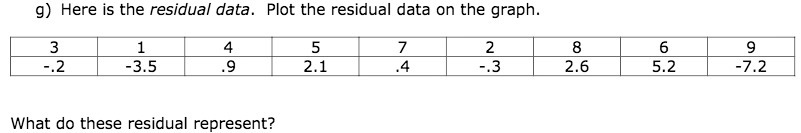
9) Here is the residual data. Plot the residual data on the graph. 3 1 4 -.2 5 7 -3.5 .9 2 8 2.1 6 9 4 -.3 2.6 5.2 -7.2 What do these residual represent
Step by Step Solution
There are 3 Steps involved in it
1 Expert Approved Answer
Step: 1 Unlock

Question Has Been Solved by an Expert!
Get step-by-step solutions from verified subject matter experts
Step: 2 Unlock
Step: 3 Unlock