

Question: 9) Please help with this question Suppose a partial ANOVA table looks as follows: Assume a = 0.01 Source SS df MS F Crit F
9) Please help with this question
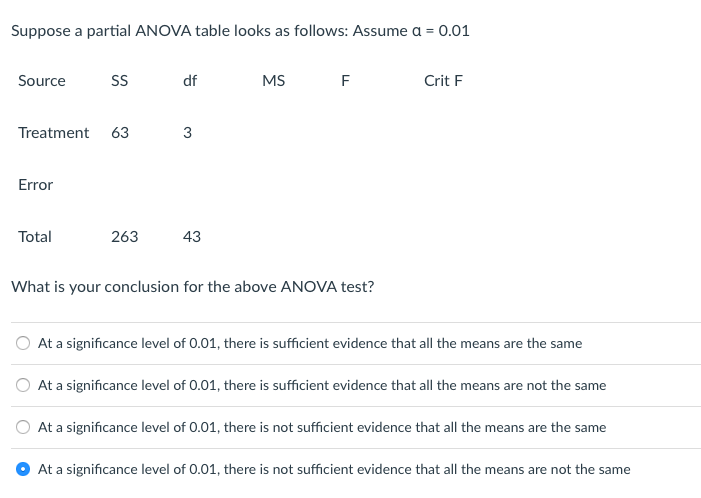
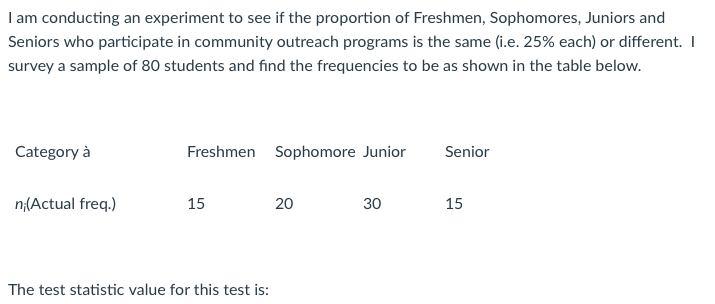
Suppose a partial ANOVA table looks as follows: Assume a = 0.01 Source SS df MS F Crit F Treatment 3 Error Total 263 43 What is your conclusion for the above ANOVA test? O At a significance level of 0.01, there is sufficient evidence that all the means are the same O At a significance level of 0.01, there is sufficient evidence that all the means are not the same O At a significance level of 0.01, there is not sufficient evidence that all the means are the same O At a significance level of 0.01, there is not sufficient evidence that all the means are not the sameI am conducting an experiment to see if the proportion of Freshmen , Sophomores , Juniors and Seniors who participate in community outreach programs is the same ( i . e . 25% each ) or different . I survey a sample of 80 students and find the frequencies to be as shown in the table below Category a Freshmen Sophomore Junio Senior ( Actual freq ) 15 On 20 15 The test statistic value for this testi
Step by Step Solution
There are 3 Steps involved in it

Get step-by-step solutions from verified subject matter experts