

Question: . [-/9 Points] DETAILS WANEFMAC6 8.3.035. MY NOTES ASK YOUR TEACHER PRACTICE ANOTHER The following table shows the approximate numbers of school goers in the
![. [-/9 Points] DETAILS WANEFMAC6 8.3.035. MY NOTES ASK YOUR TEACHER](https://s3.amazonaws.com/si.experts.images/answers/2024/06/666637dcb9601_004666637dc9447a.jpg)
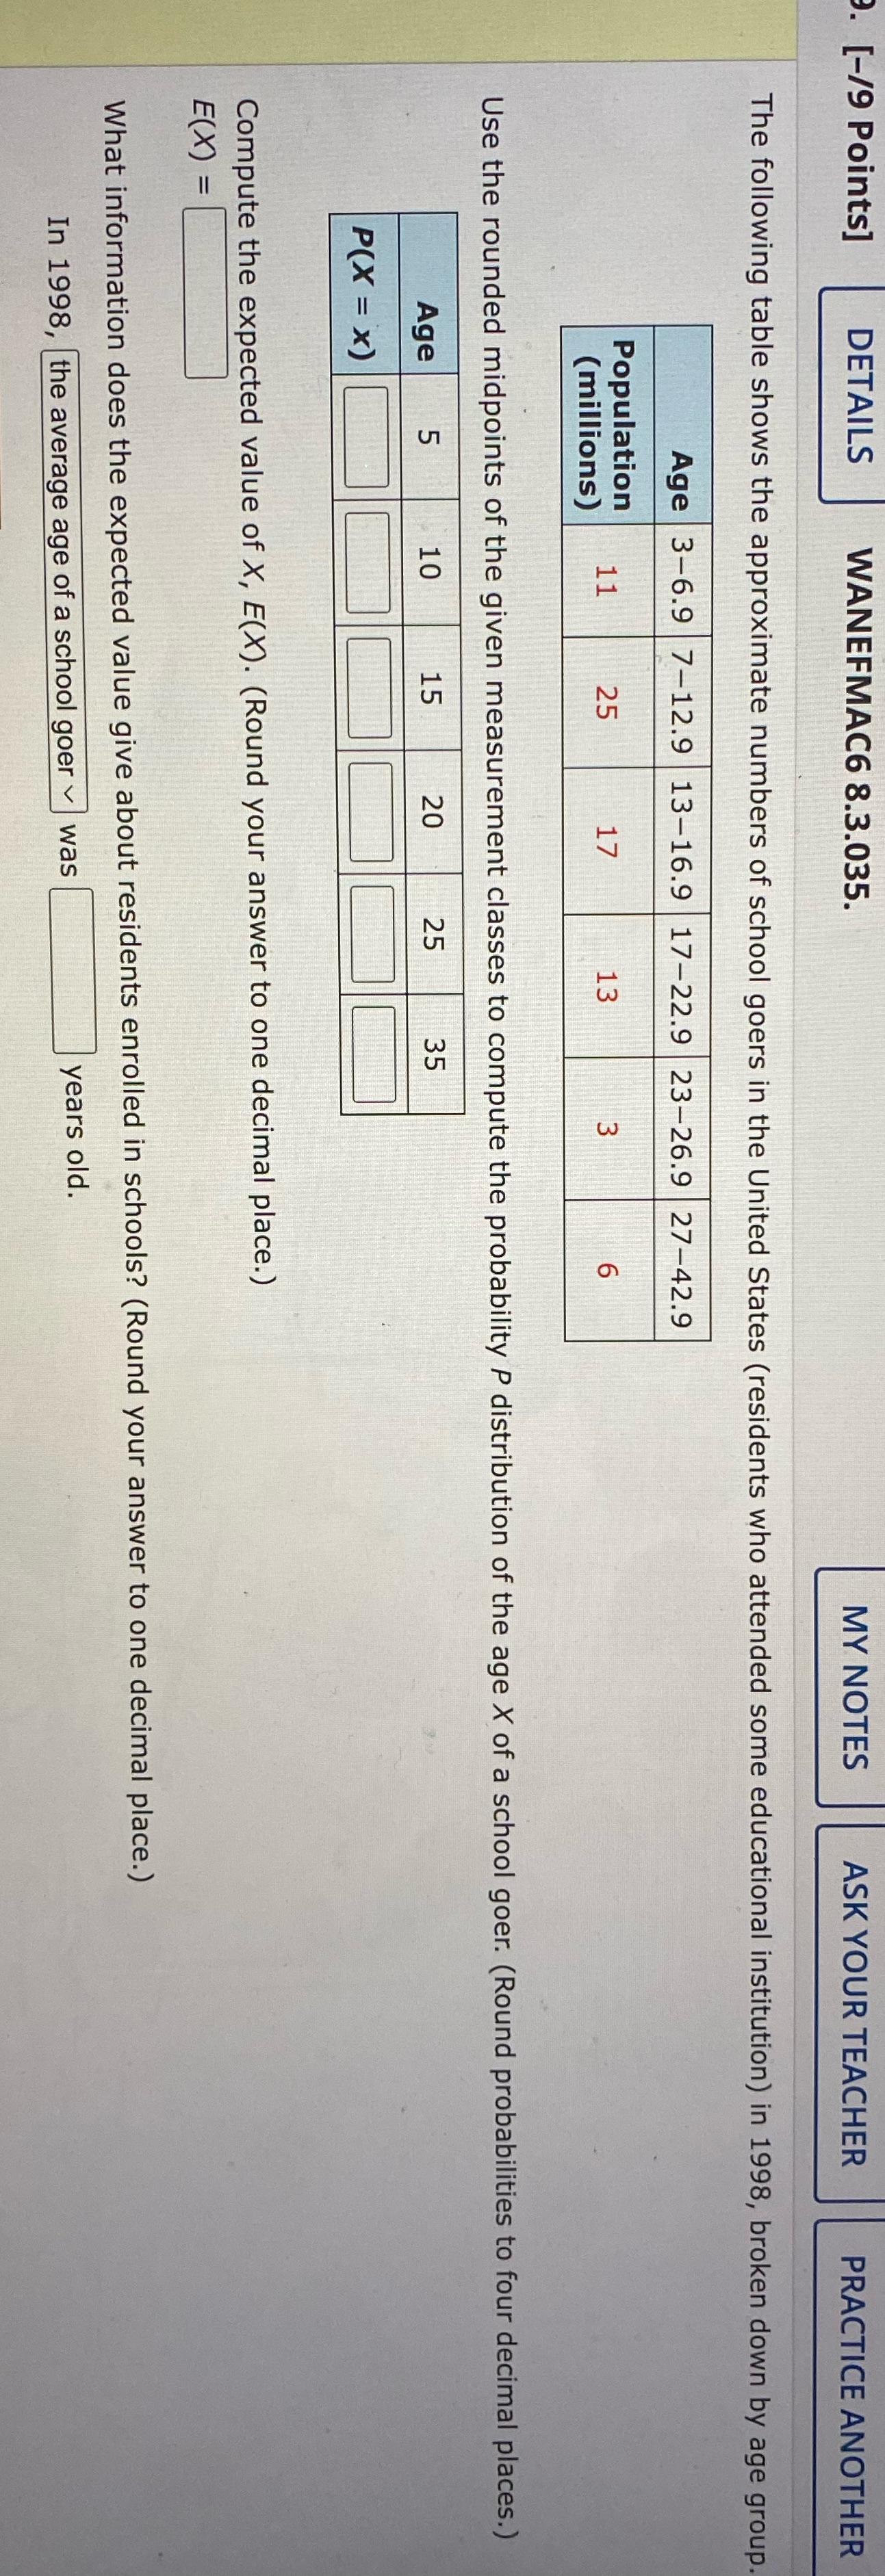
. [-/9 Points] DETAILS WANEFMAC6 8.3.035. MY NOTES ASK YOUR TEACHER PRACTICE ANOTHER The following table shows the approximate numbers of school goers in the United States (residents who attended some educational institution) in 1998, broken down by age group. Age 3-6.9 7-12.9 13-16.9 17-22.9 23-26.9 27-42.9 Population W (millions) Use the rounded midpoints of the given measurement classes to compute the probability P distribution of the age X of a school goer. (Round probabilities to four decimal places.) Age LO P(X = X) Compute the expected value of X, E(X). (Round your answer to one decimal place.) E(X ) = What information does the expected value give about residents enrolled in schools? (Round your answer to one decimal place.) In 1998, the average age of a school goer | was years old
Step by Step Solution
There are 3 Steps involved in it

Get step-by-step solutions from verified subject matter experts