

Question: 9. Pressure, psia Using the following graph, which shows phase equilibrium data for methane and normal butane (C1 /n-C4) at 220 F, indicate the
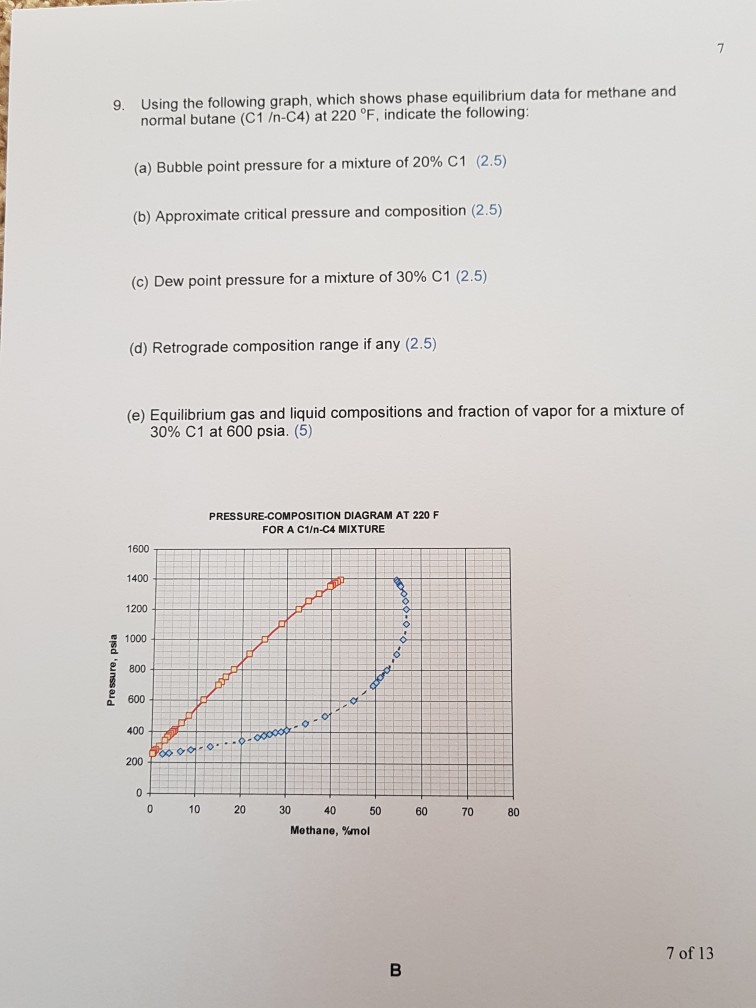
9. Pressure, psia Using the following graph, which shows phase equilibrium data for methane and normal butane (C1 /n-C4) at 220 F, indicate the following: (a) Bubble point pressure for a mixture of 20% C1 (2.5) (b) Approximate critical pressure and composition (2.5) (c) Dew point pressure for a mixture of 30% C1 (2.5) (d) Retrograde composition range if any (2.5) (e) Equilibrium gas and liquid compositions and fraction of vapor for a mixture of 30% C1 at 600 psia. (5) 1600 1400 1200 1000 800 600 400 200 0 0 PRESSURE-COMPOSITION DIAGRAM AT 220 F FOR A C1/n-C4 MIXTURE 00000-00-000000-0-0---0-0000-0-1 10 Load 20 30 40 50 Methane, %mol B 60 70 80 7 of 13 7
Step by Step Solution
3.43 Rating (156 Votes )
There are 3 Steps involved in it

Get step-by-step solutions from verified subject matter experts