

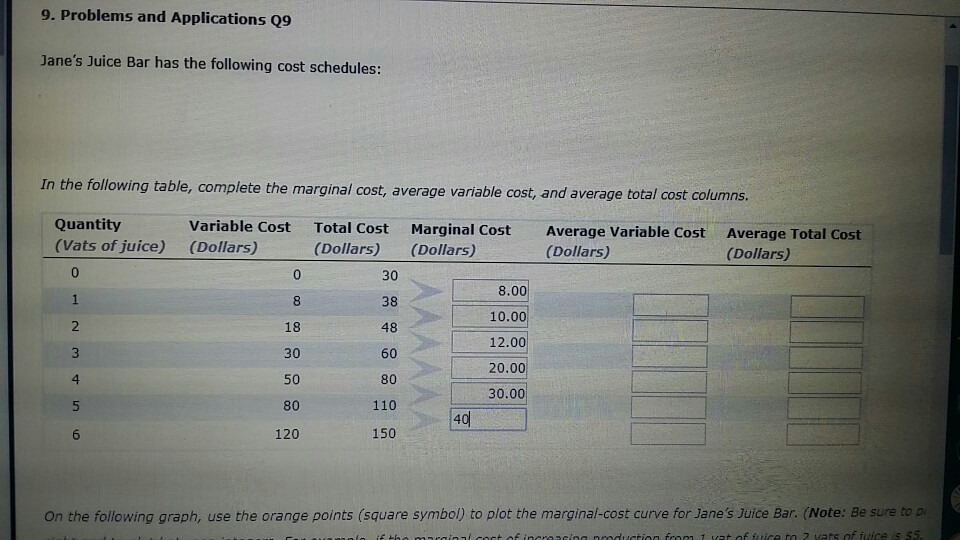
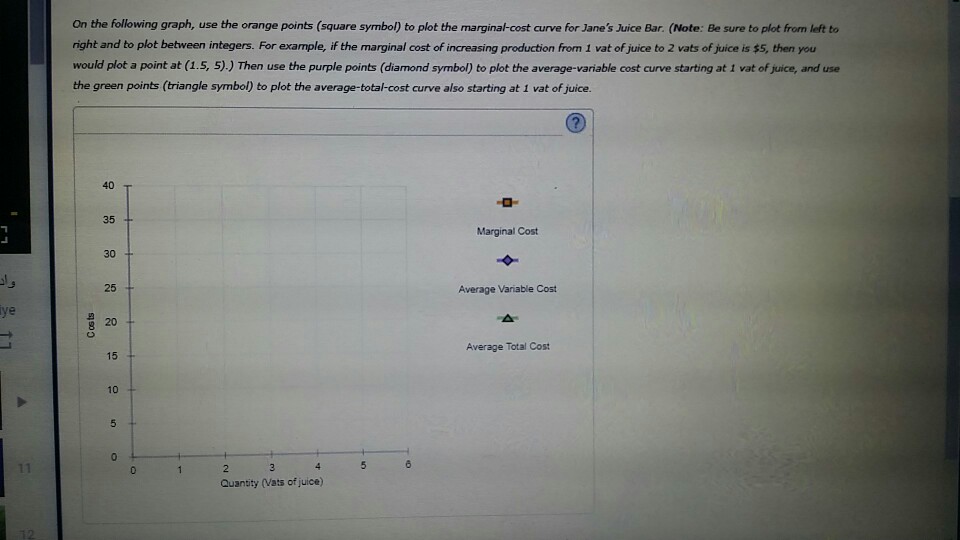
9. Problems and Applications Q9 Jane's Juice Bar has the following cost schedules: In the following...
Fantastic news! We've Found the answer you've been seeking!
Question:
Transcribed Image Text:
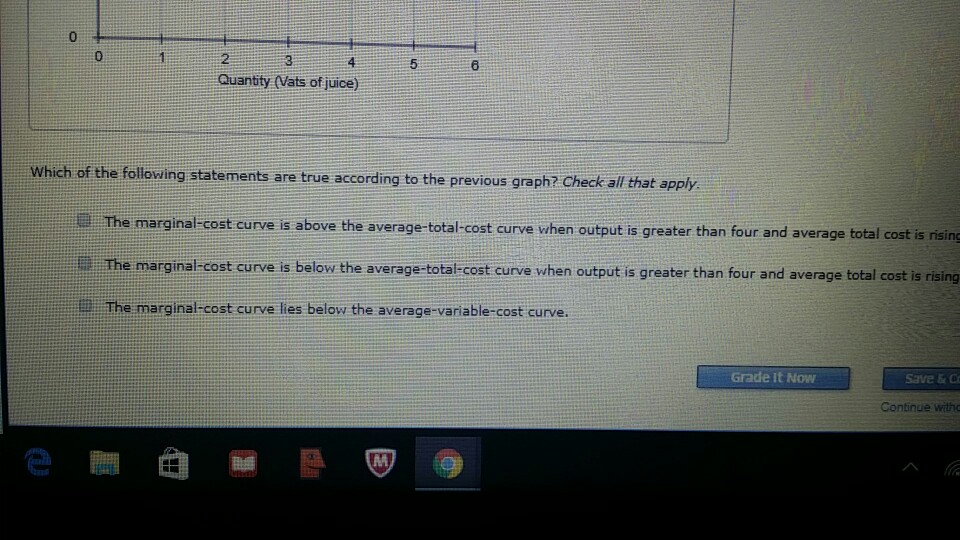
9. Problems and Applications Q9 Jane's Juice Bar has the following cost schedules: In the following table, complete the marginal cost, average variable cost, and average total cost columns. Variable Cost Total Cost Marginal Cost (Dollars) (Dollars) (Dollars) Average Variable Cost (Dollars) Quantity (Vats of juice) 0 1 2 3 4 56 0 8 18 30 50 80 120 30 38 48 60 80 110 150 40 8.00 10.00 12.00 20.00 30.00 Average Total Cost (Dollars) On the following graph, use the orange points (square symbol) to plot the marginal-cost curve for Jane's Juice Bar. (Note: Be sure to pi amplo if the marginal cost of increasing production from 1 vat of fuice to 2 vats of juice is $5. واد ye 11 12 On the following graph, use the orange points (square symbol) to plot the marginal-cost curve for Jane's Juice Bar. (Note: Be sure to plot from left to right and to plot between integers. For example, if the marginal cost of increasing production from 1 vat of juice to 2 vats of juice is $5, then you would plot a point at (1.5, 5).) Then use the purple points (diamond symbol) to plot the average-variable cost curve starting at 1 vat of juice, and use the green points (triangle symbol) to plot the average-total-cost curve also starting at 1 vat of juice. (?) Costs 40 35 30 25 20 15 10 10 5 0 0 2 3 4 Quantity (Vats of juice) 5 6 Marginal Cost Average Variable Cost Average Total Cost 0 1 2 3 4 Quantity (Vats of juice) 11 5 Which of the following statements are true according to the previous graph? Check all that apply. 6 The marginal-cost curve is above the average-total-cost curve when output is greater than our and average total cost is rising The marginal-cost curve is below the average-total-cost curve when output is greater than four and average total cost is rising The marginal-cost curve lies below the average-variable-cost curve. M Grade It Now Save & Co Continue witho 9. Problems and Applications Q9 Jane's Juice Bar has the following cost schedules: In the following table, complete the marginal cost, average variable cost, and average total cost columns. Variable Cost Total Cost Marginal Cost (Dollars) (Dollars) (Dollars) Average Variable Cost (Dollars) Quantity (Vats of juice) 0 1 2 3 4 56 0 8 18 30 50 80 120 30 38 48 60 80 110 150 40 8.00 10.00 12.00 20.00 30.00 Average Total Cost (Dollars) On the following graph, use the orange points (square symbol) to plot the marginal-cost curve for Jane's Juice Bar. (Note: Be sure to pi amplo if the marginal cost of increasing production from 1 vat of fuice to 2 vats of juice is $5. واد ye 11 12 On the following graph, use the orange points (square symbol) to plot the marginal-cost curve for Jane's Juice Bar. (Note: Be sure to plot from left to right and to plot between integers. For example, if the marginal cost of increasing production from 1 vat of juice to 2 vats of juice is $5, then you would plot a point at (1.5, 5).) Then use the purple points (diamond symbol) to plot the average-variable cost curve starting at 1 vat of juice, and use the green points (triangle symbol) to plot the average-total-cost curve also starting at 1 vat of juice. (?) Costs 40 35 30 25 20 15 10 10 5 0 0 2 3 4 Quantity (Vats of juice) 5 6 Marginal Cost Average Variable Cost Average Total Cost 0 1 2 3 4 Quantity (Vats of juice) 11 5 Which of the following statements are true according to the previous graph? Check all that apply. 6 The marginal-cost curve is above the average-total-cost curve when output is greater than our and average total cost is rising The marginal-cost curve is below the average-total-cost curve when output is greater than four and average total cost is rising The marginal-cost curve lies below the average-variable-cost curve. M Grade It Now Save & Co Continue witho
Expert Answer:

Related Book For 
Posted Date:
Students also viewed these economics questions
-
Janes Juice Bar has the following cost schedules: a. Calculate average variable cost, average total cost, and marginal cost for each quantity. b. Graph all three curves. What is the relationship...
-
Use equation above to plot a tafel cathodic curve for n <0.15 volts, (calculate for the current value for( -0.1, -0.25, -0.45, and -0.6)? Then plot log i vs overpotential O + 2e- i = io. exp nF RT kf...
-
The Blending Department of Luongo Company has the following cost and production data for the month of April. Costs: Work in process, April 1 Direct materials: 100% complete ......$100,000 Conversion...
-
Use the data given in Table to construct a frequency distribution with a first class (in millions) of 50-99. Novel Copies Sold (millions) Don Quixote . . . . . . . . . . . . . . . . . . . . . . . . ....
-
Results from Percy Corporations most recent year of operations is presented in the following table: Operating income.......................................... $ 8,060 Total...
-
Why does the Bad Debts Expense account usually not have the same adjusted balance as the Allowance for Doubtful Accounts?
-
Consider the following cash flow diagram. What is the value of \(X\) if the internal rate of return is 15 percent? a. \(\$ 246\) b. \(\$ 255\) c. \(\$ 281\) d. \(\$ 290\) 0 $400 X X 1 2
-
The Feed 'N Ship Ranch fattens cattle for local farmers and ships them to meat markets in Kansas City and Omaha. The owners of the ranch seek to determine the amounts of cattle feed to buy so that...
-
Introduction : provide the reader a bulleted list of all the points your will discuss in the presentation. Database Management Systems: identify some basic concepts associated with database...
-
1. Mr. Albert has a piece of property he has used in his business for 25 years. He is moving his business across the country and needs to get rid of the real estate he currently owns, as he won't be...
-
Create an effective cover letter. Compose an effective resume. Resume and Cover Letter Using the job you identified in Module 1, following the guidelines from the above readings, write a resume and a...
-
How do strategic leaders effectively synchronize organizational objectives with dynamic market forces to optimize long-term viability?
-
A square - section test piece is being used in a tensile test. The width and breadth of the test piece are each 15 mm. Calculate the stress in the test piece when a load of 3150 N is applied.
-
Assume the following economy produces only skateboards and the year 1981 is the base year. . Year Quantity Produced Price 1981 75 $30 1982 100 $33 1983 125 $38 1984 150 $42 What is the nominal GDP...
-
A force of 1 Newton will cause a mass of 1 kg to have an acceleration of 1 m/s 2 . Thus it follows that a force of 5 Newtons applied to a mass of 5 kg will cause it to acquire an acceleration of?...
-
What is the impact on the accounting if the company is not a going concern?
-
Assume that a company has revenue of $50,000,000, COGS of $30,000,000, other administration expenses of $10,000,000, deprecation expense of $5,000,000, interest expense on debt of $1,000,000 and tax...
-
Which property determines whether a control is available to the user during run time? a. Available b. Enabled c. Unavailable d. Disabled
-
Between 2004 and 2007, total U.S. employment increased by 6.8 million workers, but the number of unemployed workers declined by only 1.1 million. How are these numbers consistent with each other? Why...
-
An early freeze in California sours the lemon crop. Explain what happens to consumer surplus in the market for lemons. Explain what happens to consumer surplus in the market for lemonade. Illustrate...
-
Is the price elasticity of supply usually larger in the short run or in the long run? Why?
-
If the cost of textbooks were included in tuition, what would likely happen to their prices? Why?
-
True or false? In the United States, the invisible hand ensures that only socially valuable businesses are started. Why?
-
Are most businesses in the United States corporations? If not, what are most businesses?

Study smarter with the SolutionInn App