

Question: 9. Refer back to the histogram from question #3. a. Compute the mean number of children for the group surveyed b. Compute the median number
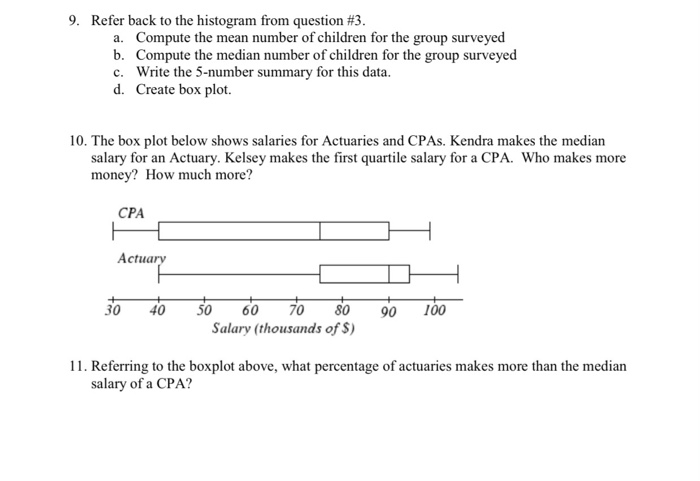
9. Refer back to the histogram from question #3. a. Compute the mean number of children for the group surveyed b. Compute the median number of children for the group surveyed c. Write the 5-number summary for this data. d. Create box plot. 10. The box plot below shows salaries for Actuaries and CPAs. Kendra makes the median salary for an Actuary. Kelsey makes the first quartile salary for a CPA. Who makes more money? How much more? CPA Actuary 30 40 60 90 50 70 80 Salary (thousands of $) 100 11. Referring to the boxplot above, what percentage of actuaries makes more than the median salary of a CPA? 9. Refer back to the histogram from question #3. a. Compute the mean number of children for the group surveyed b. Compute the median number of children for the group surveyed c. Write the 5-number summary for this data. d. Create box plot. 10. The box plot below shows salaries for Actuaries and CPAs. Kendra makes the median salary for an Actuary. Kelsey makes the first quartile salary for a CPA. Who makes more money? How much more? CPA Actuary 30 40 60 90 50 70 80 Salary (thousands of $) 100 11. Referring to the boxplot above, what percentage of actuaries makes more than the median salary of a CPA
Step by Step Solution
There are 3 Steps involved in it

Get step-by-step solutions from verified subject matter experts