

Question: 9: Run the function cor . demo () a) Generate a scatterplot that has a correlation of about -0.80 (give or take 10.02). Have this
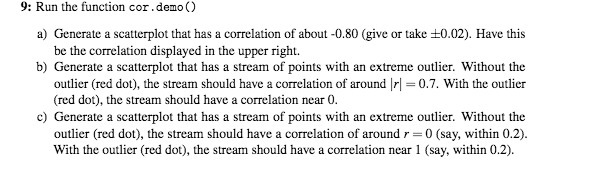
9: Run the function cor . demo () a) Generate a scatterplot that has a correlation of about -0.80 (give or take 10.02). Have this be the correlation displayed in the upper right. b) Generate a scatterplot that has a stream of points with an extreme outlier. Without the outlier (red dot), the stream should have a correlation of around | | = 0.7. With the outlier (red dot), the stream should have a correlation near 0. c) Generate a scatterplot that has a stream of points with an extreme outlier. Without the outlier (red dot), the stream should have a correlation of around r = 0 (say, within 0.2). With the outlier (red dot), the stream should have a correlation near 1 (say, within 0.2)
Step by Step Solution
There are 3 Steps involved in it

Get step-by-step solutions from verified subject matter experts