

Question: 9 statistics webassign.net/web/Student/Assignment-Responses/last?dep=22657023 Below is the scatterplot and corresponding data for the height and weight of 11 randomly selected adults. You should notice something odd
9 statistics
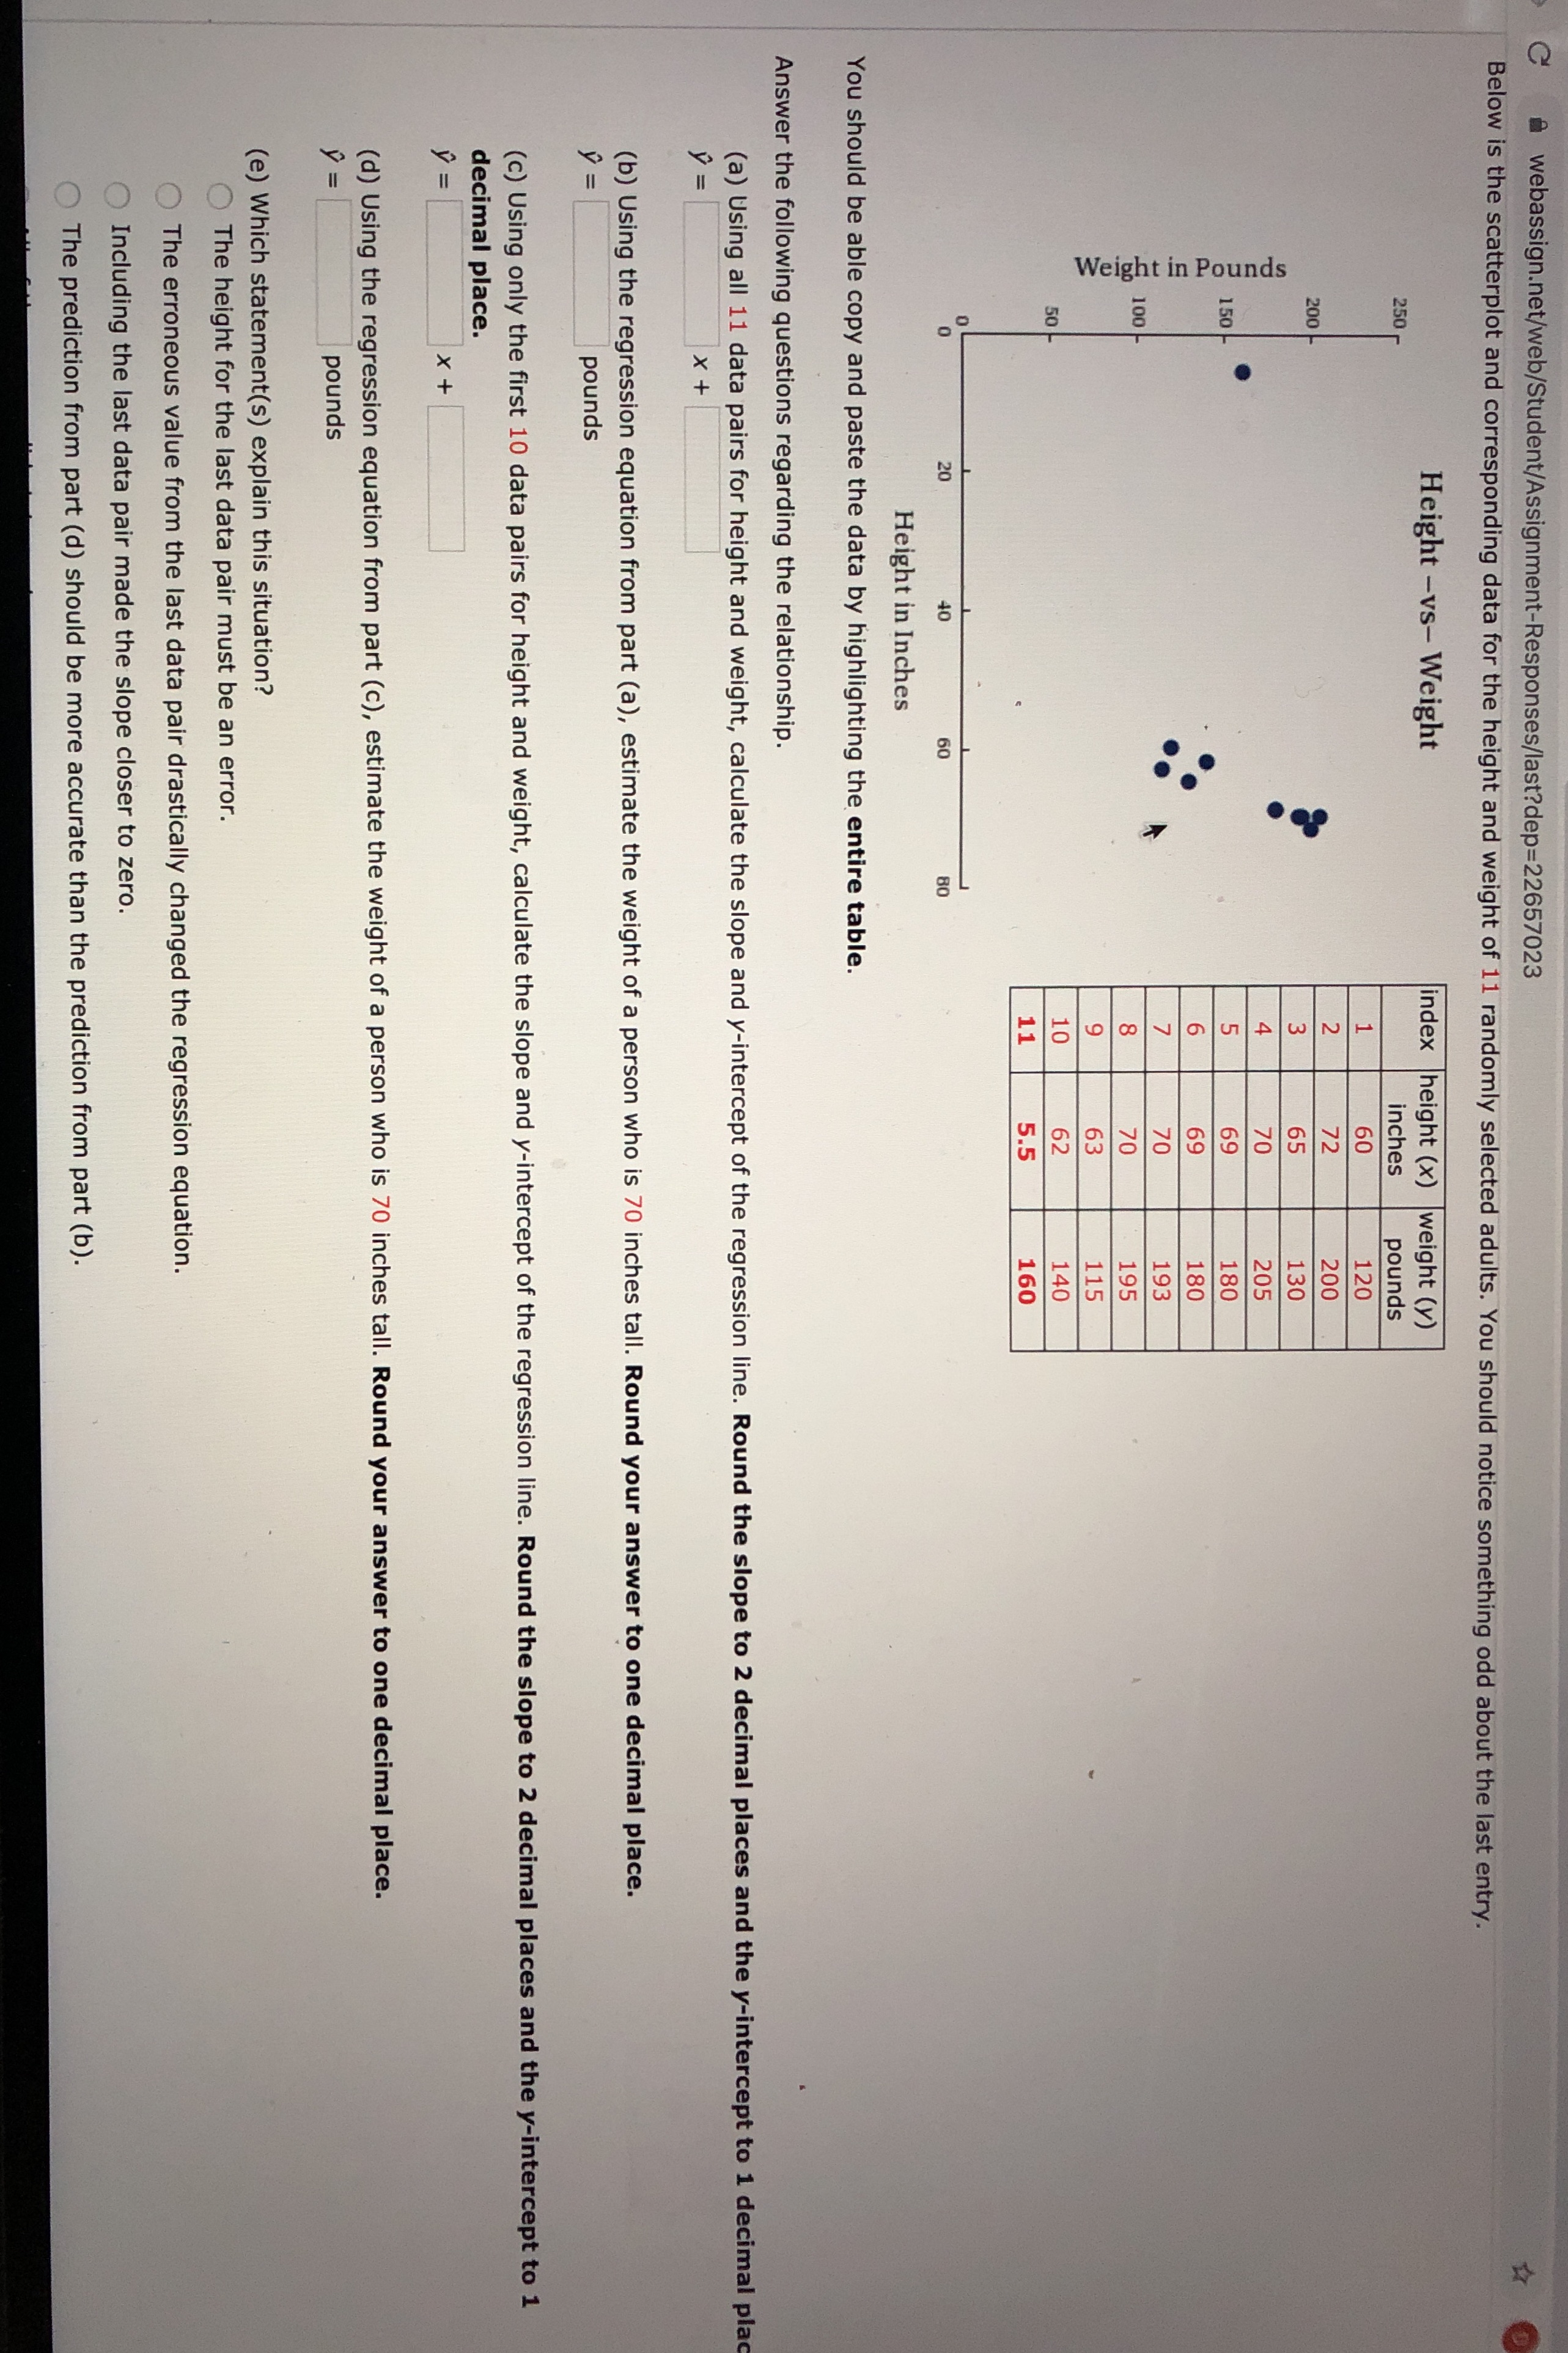
webassign.net/web/Student/Assignment-Responses/last?dep=22657023 Below is the scatterplot and corresponding data for the height and weight of 11 randomly selected adults. You should notice something odd about the last entry. Height -vs- Weight index height (x) weight (y) 250 inches pounds 120 200 200 Weight in Pounds 130 205 180 180 100 193 195 140 160 40 60 Height in Inches You should be able copy and paste the data by highlighting the entire table. Answer the following questions regarding the relationship. (a) Using all 11 data pairs for height and weight, calculate the slope and y-intercept of the regression line. Round the slope to 2 decimal places and the y-intercept to 1 decimal pla * + (b) Using the regression equation from part (a), estimate the weight of a person who is 70 inches tall. Round your answer to one decimal place. y = pounds (c) Using only the first 10 data pairs for height and weight, calculate the slope and y-intercept of the regression line. Round the slope to 2 decimal places and the y-intercept to 1 decimal place. y = x+ (d) Using the regression equation from part (c), estimate the weight of a person who is 70 inches tall. Round your answer to one decimal place. 1 = pounds (e) Which statement(s) explain this situation? The height for the last data pair must be an error. The erroneous value from the last data pair drastically changed the regression equation. Including the last data pair made the slope closer to zero. The prediction from part (d) should be more accurate than the prediction from part (b)
Step by Step Solution
There are 3 Steps involved in it

Get step-by-step solutions from verified subject matter experts