

Question: (9) Stem and Leaf plot A random sample of twenty test scores is listed below. 87 76 98 77 90 95 88 85 66 89
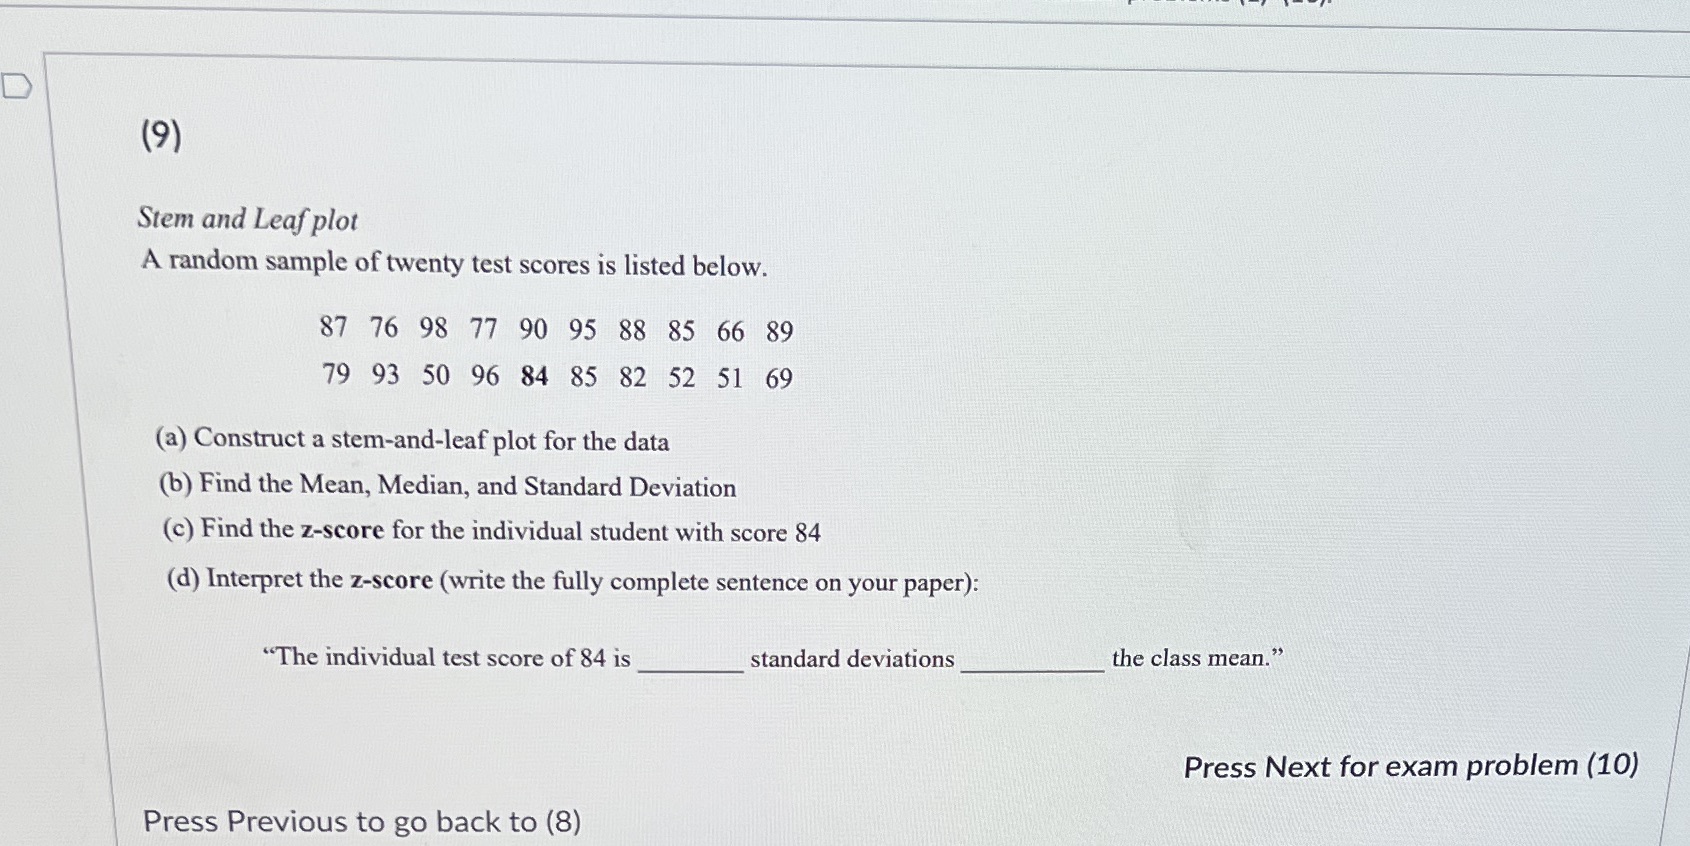
(9) Stem and Leaf plot A random sample of twenty test scores is listed below. 87 76 98 77 90 95 88 85 66 89 79 93 50 96 84 85 82 52 51 69 (a) Construct a stem-and-leaf plot for the data (b) Find the Mean, Median, and Standard Deviation (c) Find the z-score for the individual student with score 84 (d) Interpret the z-score (write the fully complete sentence on your paper): "The individual test score of 84 is standard deviations the class mean." Press Next for exam problem (10) Press Previous to go back to (8)
Step by Step Solution
There are 3 Steps involved in it
1 Expert Approved Answer
Step: 1 Unlock

Question Has Been Solved by an Expert!
Get step-by-step solutions from verified subject matter experts
Step: 2 Unlock
Step: 3 Unlock