

Question: 9. The data in the table below represent number of months spent training (x) and finish times in minutes (y) for a 5K footrace.
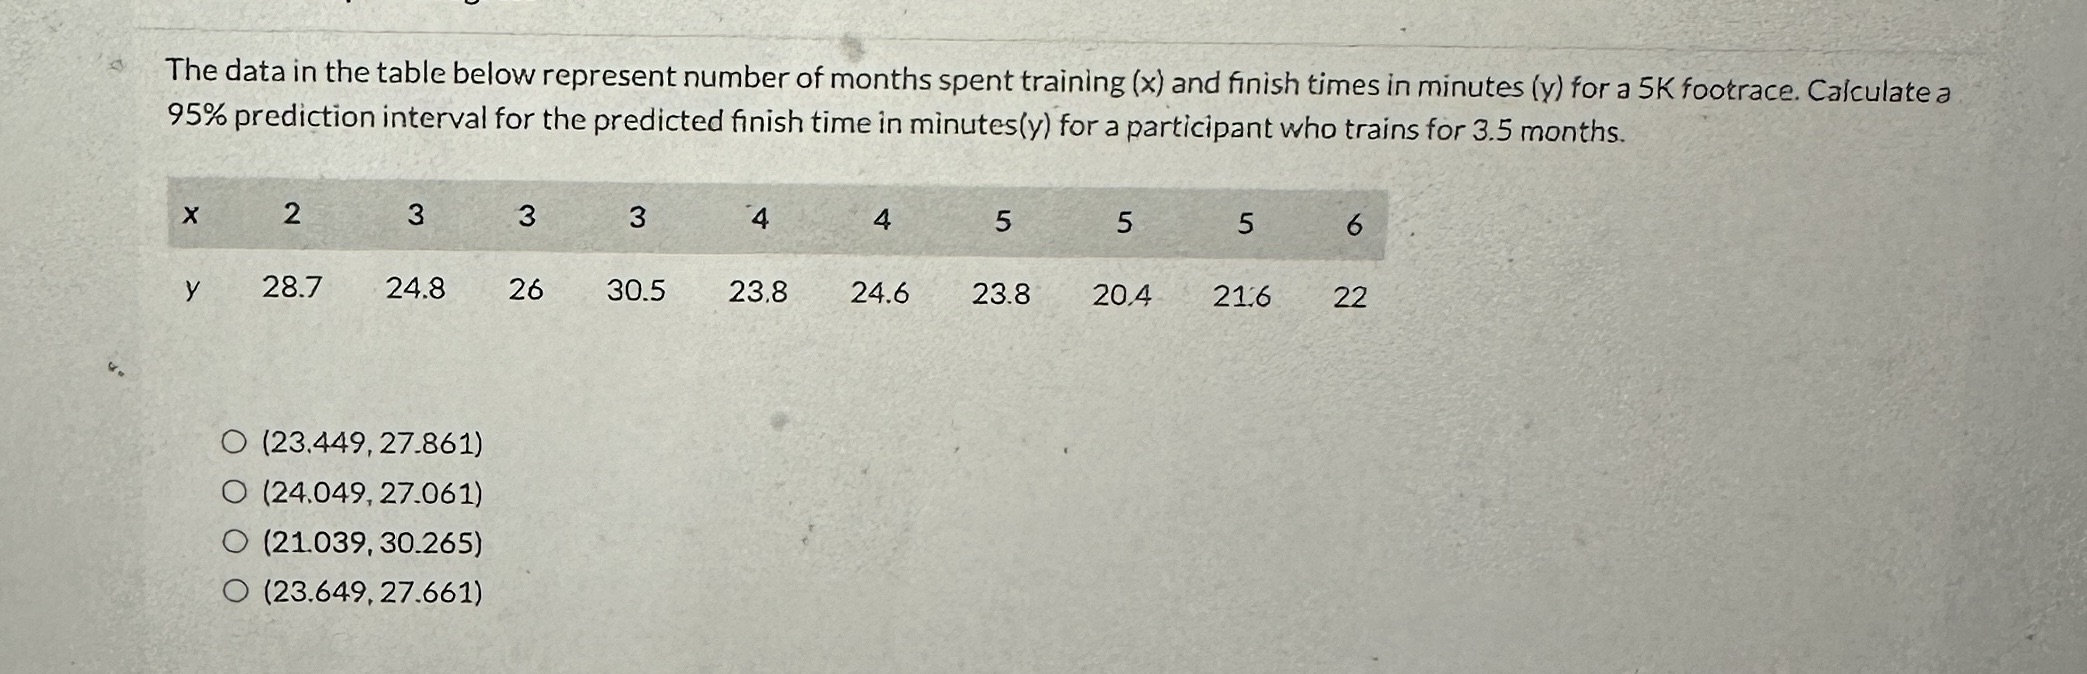
9. The data in the table below represent number of months spent training (x) and finish times in minutes (y) for a 5K footrace. Calculate a 95% prediction interval for the predicted finish time in minutes(y) for a participant who trains for 3.5 months. X 2 3 3 3 4 4 5 5 5 6 y 28.7 24.8 26 30.5 23.8 24.6 23.8 20.4 21:6 22 O (23.449, 27.861) O (24.049, 27.061) O (21.039, 30.265) O (23.649, 27.661)
Step by Step Solution
There are 3 Steps involved in it
1 Expert Approved Answer
Step: 1 Unlock

Question Has Been Solved by an Expert!
Get step-by-step solutions from verified subject matter experts
Step: 2 Unlock
Step: 3 Unlock