

Question: 9. The sales data in the table below is for a company in a cyclical industry that frequently makes acquisitions and divestitures. Calculate the simple
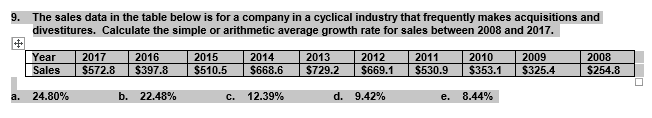
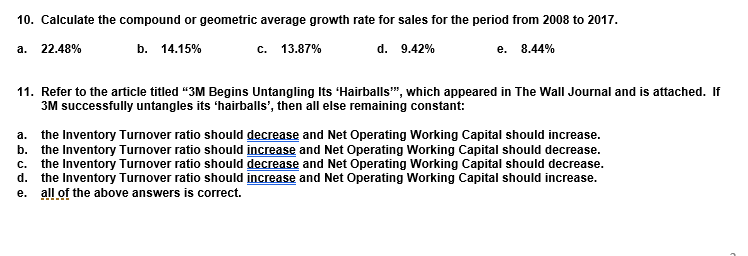
9. The sales data in the table below is for a company in a cyclical industry that frequently makes acquisitions and divestitures. Calculate the simple or arithmetic average growth rate for sales between 2008 and 2017. Year 2017 |2016 |2015 2014|2013 2012 T 2011-T 2010 T2009,-12008 Sales S572.8 $397.8 $510.5$668.6 $729.2 S669.1 $530.9 $353.1 $325.4 $254.8 a. 24.80% b. 22.48% c. 12.39% d. 9.42% 8.44% e. 10. Calculate the compound or geometric average growth rate for sales for the period from 2008 to 2017 a. 22.48% b. 14.15% c. 13.87% d. 9.42% e. 8.44% 11. Refer to the article titled "3M Begins Untangling Its 'Hairballs"", which appeared in The Wall Journal and is attached. If 3M successfully untangles its 'hairballs', then all else remaining constant: a. b. c. d. e. the Inventory Turnover ratio should decrease and Net Operating Working Capital should increase the Inventory Turnover ratio should increase and Net Operating Working Capital should decrease. the Inventory Turnover ratio should decrease and Net Operating Working Capital should decrease. the Inventory Turnover ratio should increase and Net Operating Working Capital should increase. all of the above answers is correct
Step by Step Solution
There are 3 Steps involved in it

Get step-by-step solutions from verified subject matter experts