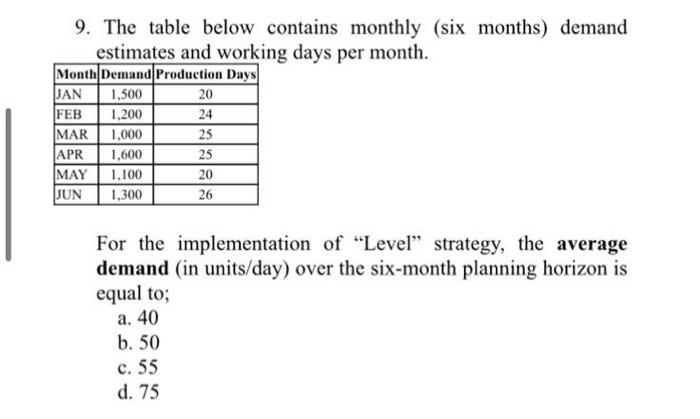
Question: 9. The table below contains monthly (six months) demand estimates and working days per month. Month Demand Production Days JAN 1,500 20 FEB 1,200 24

9. The table below contains monthly (six months)
9. The table below contains monthly (six months) demand estimates and working days per month. Month Demand Production Days JAN 1,500 20 FEB 1,200 24 MAR 1,000 25 APR 1,600 25 MAY 1,100 20 JUN 1,300 26 For the implementation of "Level" strategy, the average demand (in units/day) over the six-month planning horizon is equal to; a. 40 b. 50 c. 55 d. 75

Step by Step Solution

There are 3 Steps involved in it

1 Expert Approved Answer
Step: 1 Unlock blur-text-image
Question Has Been Solved by an Expert!

Get step-by-step solutions from verified subject matter experts

Step: 2 Unlock
Step: 3 Unlock

Students Have Also Explored These Related General Management Questions!