

Question: 9. To plot the relationship between X and Y as a line we would use: plt lineplot (x,y) plt.plot (x,y) pltscatter (x,y) plt plotline (x,y)
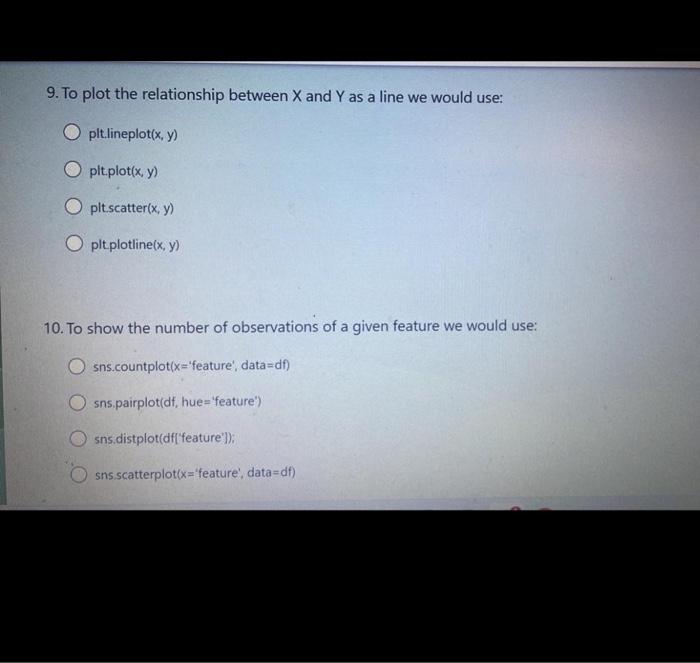
9. To plot the relationship between X and Y as a line we would use: plt lineplot (x,y) plt.plot (x,y) pltscatter (x,y) plt plotline (x,y) 10. To show the number of observations of a given feature we would use: sns.countplot (x= 'feature', data =df) sns.pairplot(df, hue ='feature') sns.distplot(df['feature']); sns.scatterplot (x= 'feature', data =df)
Step by Step Solution
There are 3 Steps involved in it
1 Expert Approved Answer
Step: 1 Unlock

Question Has Been Solved by an Expert!
Get step-by-step solutions from verified subject matter experts
Step: 2 Unlock
Step: 3 Unlock