

Question: 9. Use the following data set and create a grouped frequency distribution table. Be sure to include the proportion and percentage columns. 30 54 89
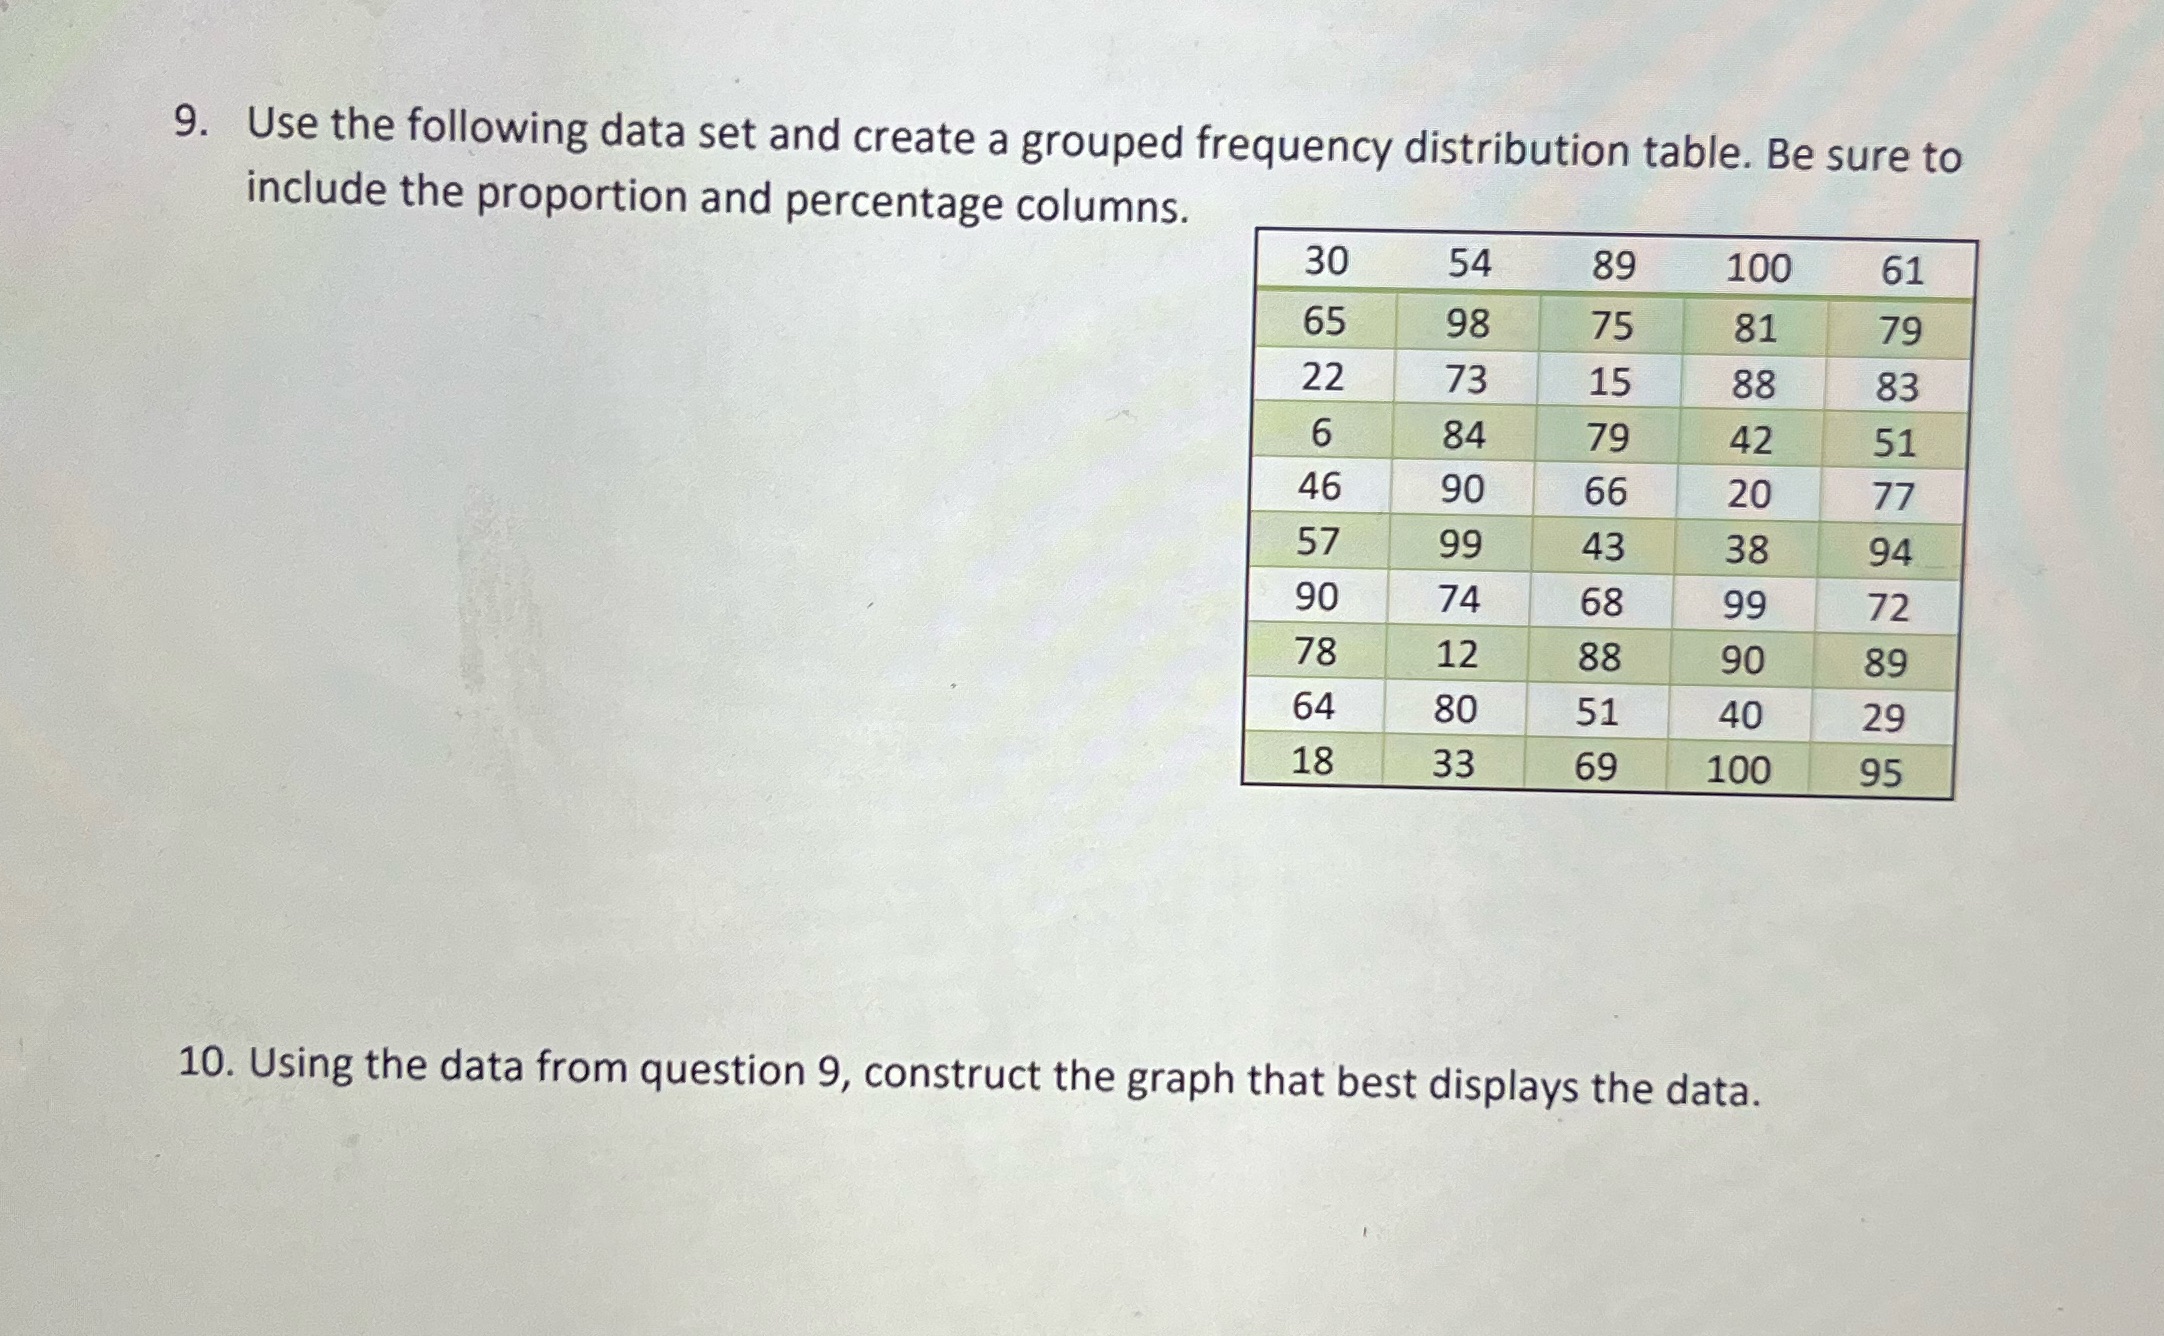
9. Use the following data set and create a grouped frequency distribution table. Be sure to include the proportion and percentage columns. 30 54 89 100 61 65 98 75 81 79 22 73 15 88 83 6 84 79 42 51 46 90 66 20 77 57 99 43 38 94 90 74 68 99 72 78 12 88 90 89 64 80 51 40 29 18 33 69 100 95 10. Using the data from question 9, construct the graph that best displays the data
Step by Step Solution
There are 3 Steps involved in it
1 Expert Approved Answer
Step: 1 Unlock

Question Has Been Solved by an Expert!
Get step-by-step solutions from verified subject matter experts
Step: 2 Unlock
Step: 3 Unlock