

Question: * 9 You obtain the following (sample) data: 56, 77, 79, 68, 69, 68, 68, 68, 50, 55, 55, 78, 72. (a) Arrange the data
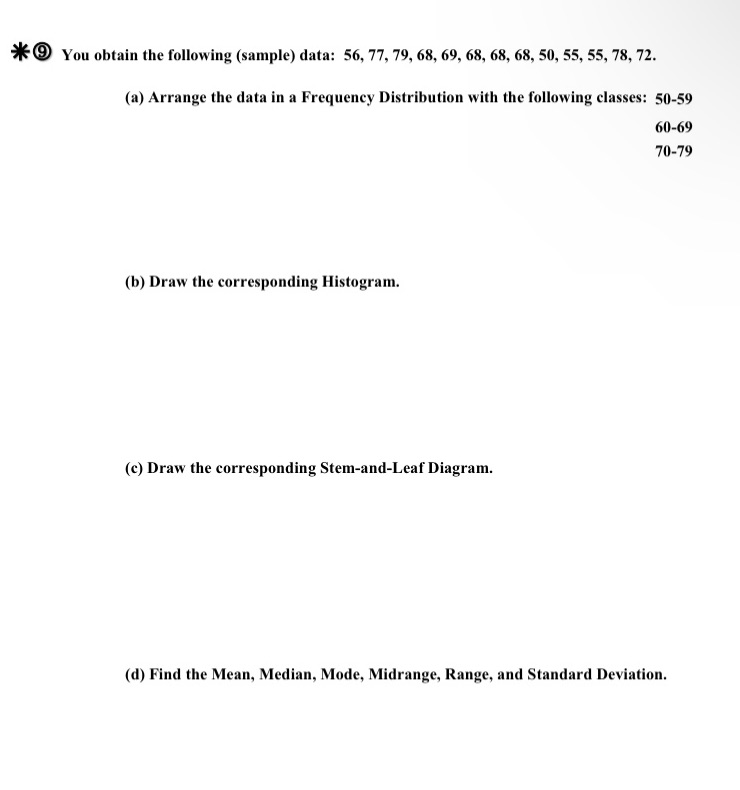
* 9 You obtain the following (sample) data: 56, 77, 79, 68, 69, 68, 68, 68, 50, 55, 55, 78, 72. (a) Arrange the data in a Frequency Distribution with the following classes: 50-59 60-69 70-79 (b) Draw the corresponding Histogram. (c) Draw the corresponding Stem-and-Leaf Diagram. (d) Find the Mean, Median, Mode, Midrange, Range, and Standard Deviation
Step by Step Solution
There are 3 Steps involved in it
1 Expert Approved Answer
Step: 1 Unlock

Question Has Been Solved by an Expert!
Get step-by-step solutions from verified subject matter experts
Step: 2 Unlock
Step: 3 Unlock