

Question: 936 Question Help Old Instructor-created question The pass completion percentages of 10 college football quarterbacks for their freshman and sophomore seasons are shown in the
936
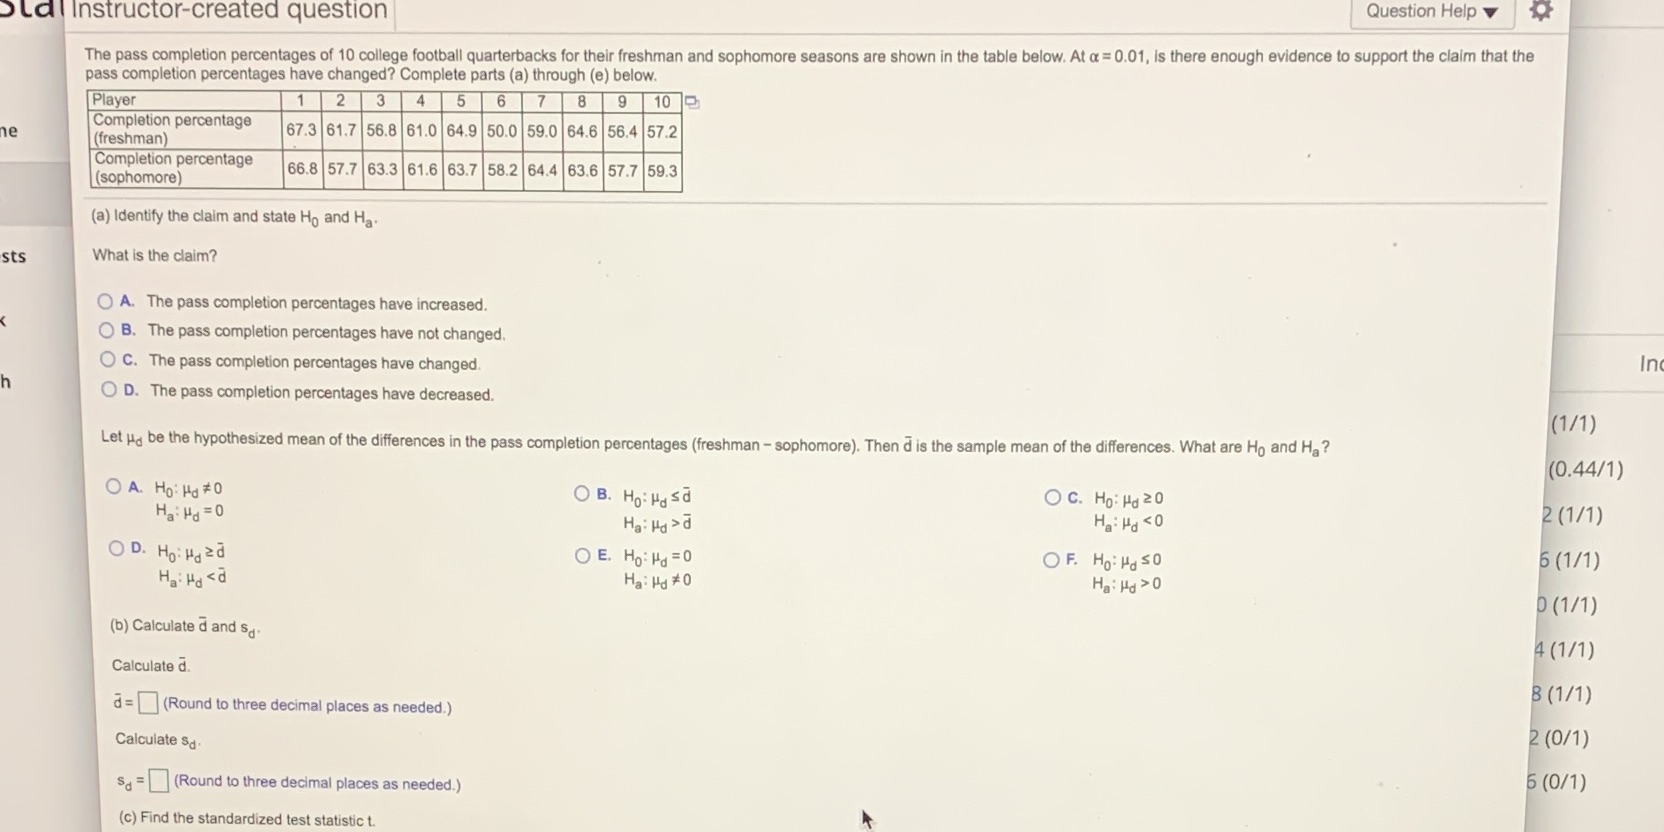
Question Help Old Instructor-created question The pass completion percentages of 10 college football quarterbacks for their freshman and sophomore seasons are shown in the table below. At a = 0.01, is there enough evidence to support the claim that the pass completion percentages have changed? Complete parts (a) through (e) below. Player 2 3 5 6 8 9 10 Completion percentage 67.3 61.7 56.8 61.0 64.9 50.0 59.0 64.6 56.4 57.2 (freshman) Completion percentage 66.8 57.7 63.3 61.6 63.7 58.2 64.4 63.6 57.7 59.3 (sophomore) (a) Identify the claim and state Ho and Ha sts What is the claim? O A. The pass completion percentages have increased. O B. The pass completion percentages have not changed. In O C. The pass completion percentages have changed. O D. The pass completion percentages have decreased. (1/1) Let up be the hypothesized mean of the differences in the pass completion percentages (freshman - sophomore). Then d is the sample mean of the differences. What are Ho and Ha? (0.44/1) O A. Ho: Hd # 0 OB. Ho: Hasa O C. Ho: Hd 20 2 (1/1) Ha: Hd = 0 Ha: Hd > d He : Hd
Step by Step Solution
There are 3 Steps involved in it

Get step-by-step solutions from verified subject matter experts