

Question: 9:45 Il 5G +0 Question content area top Part 1 1. Use a stem-and-leaf plot to display the data, which represent the numbers of
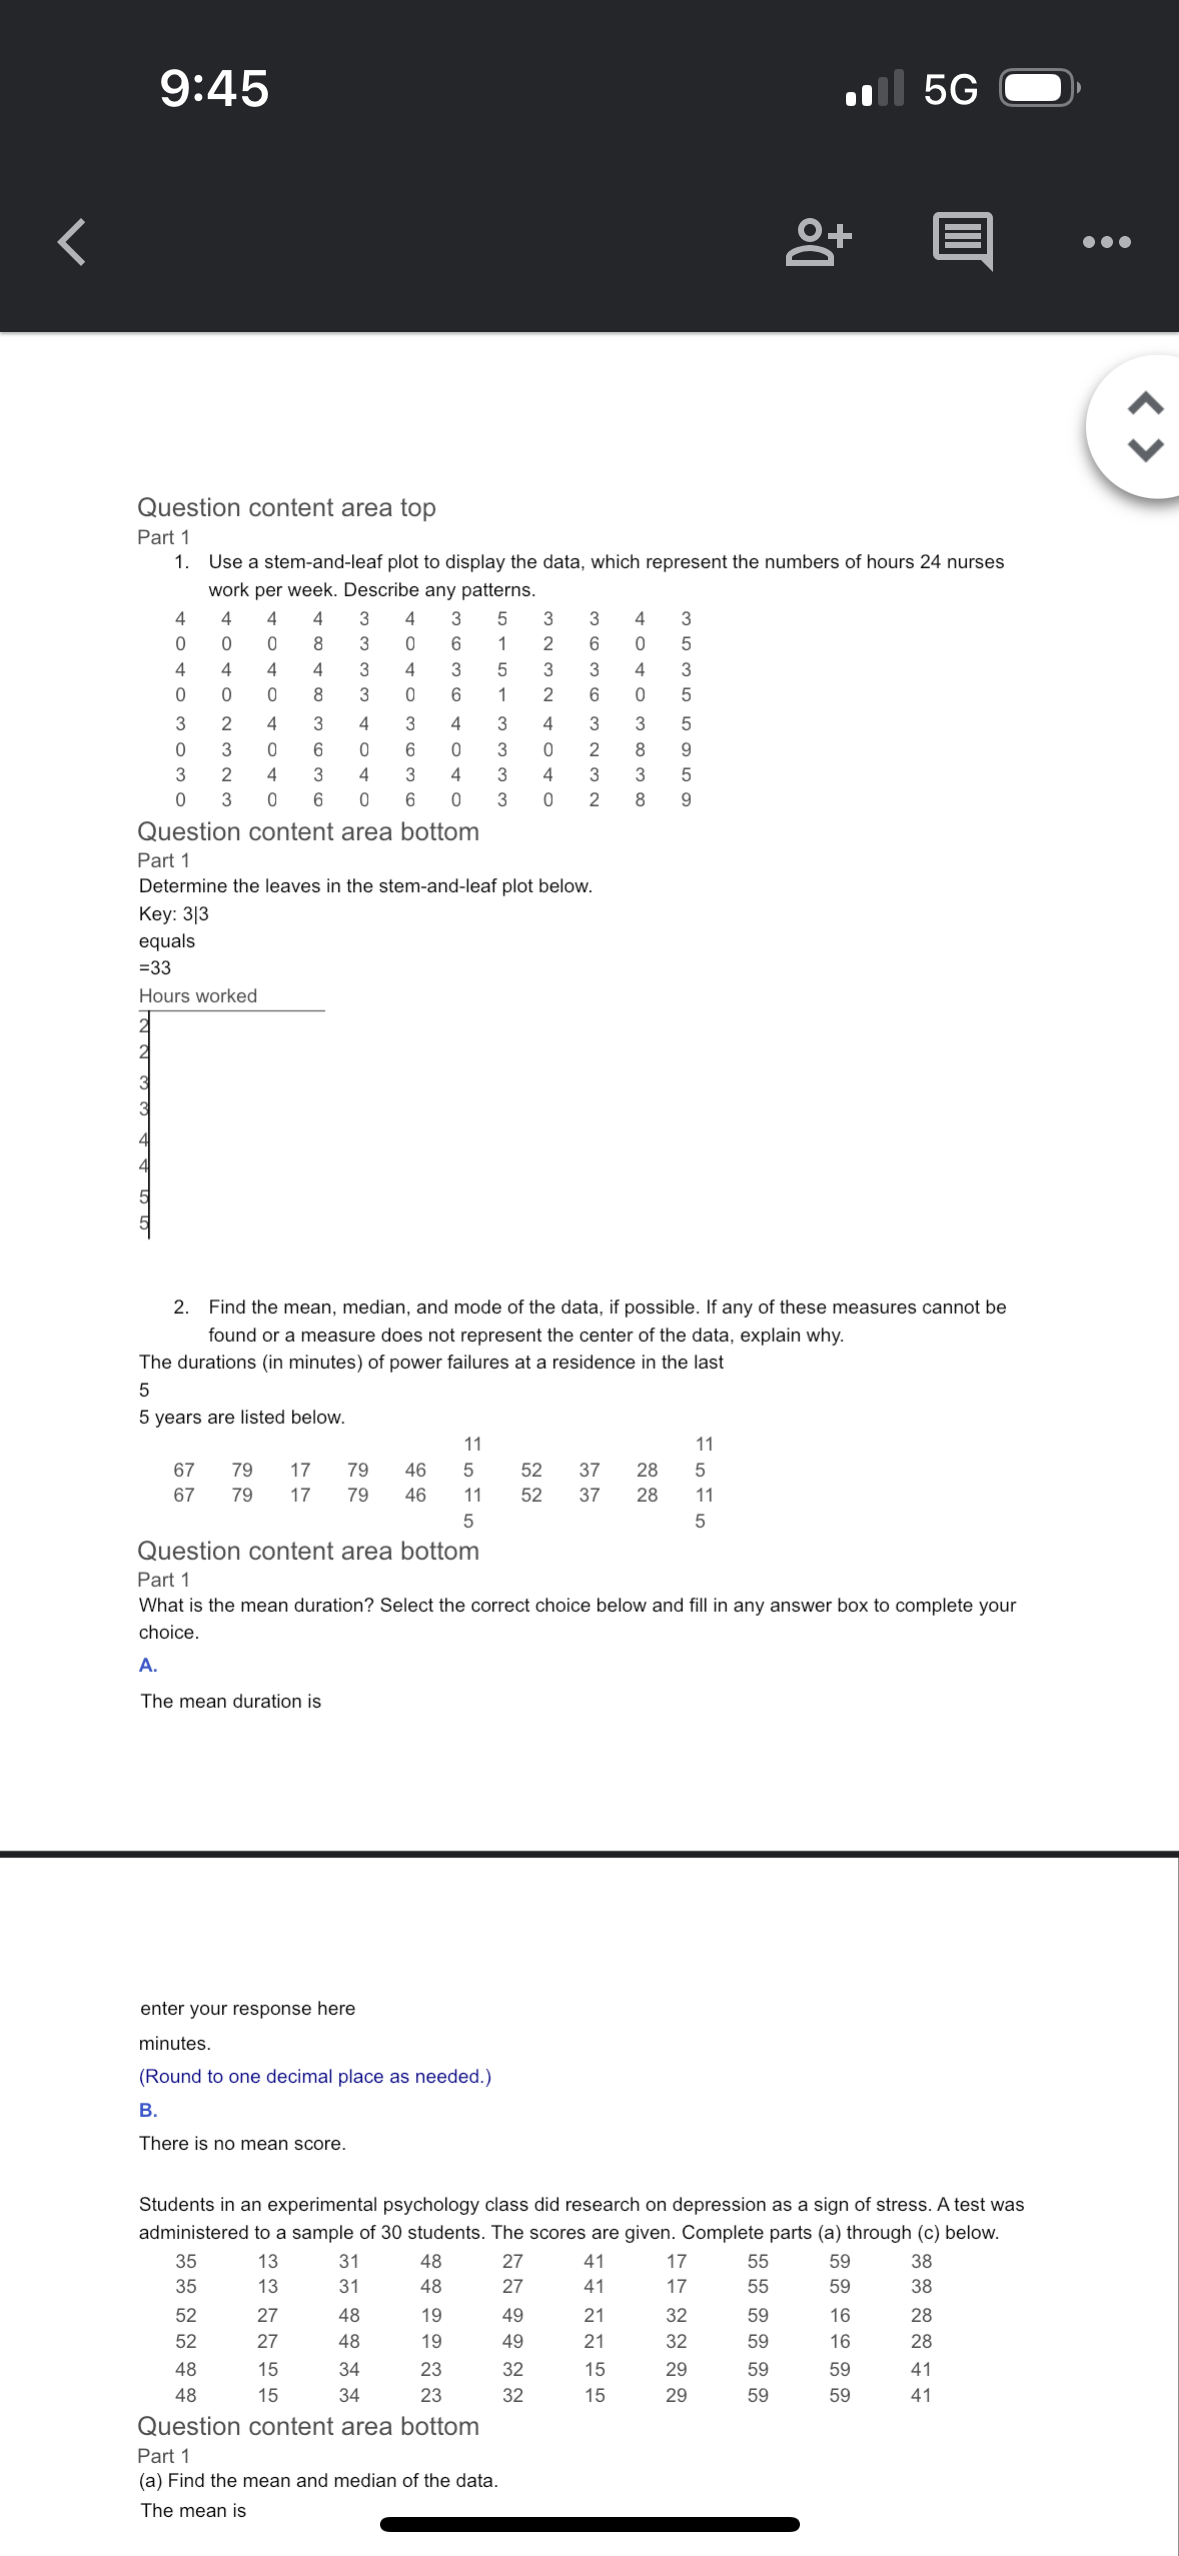
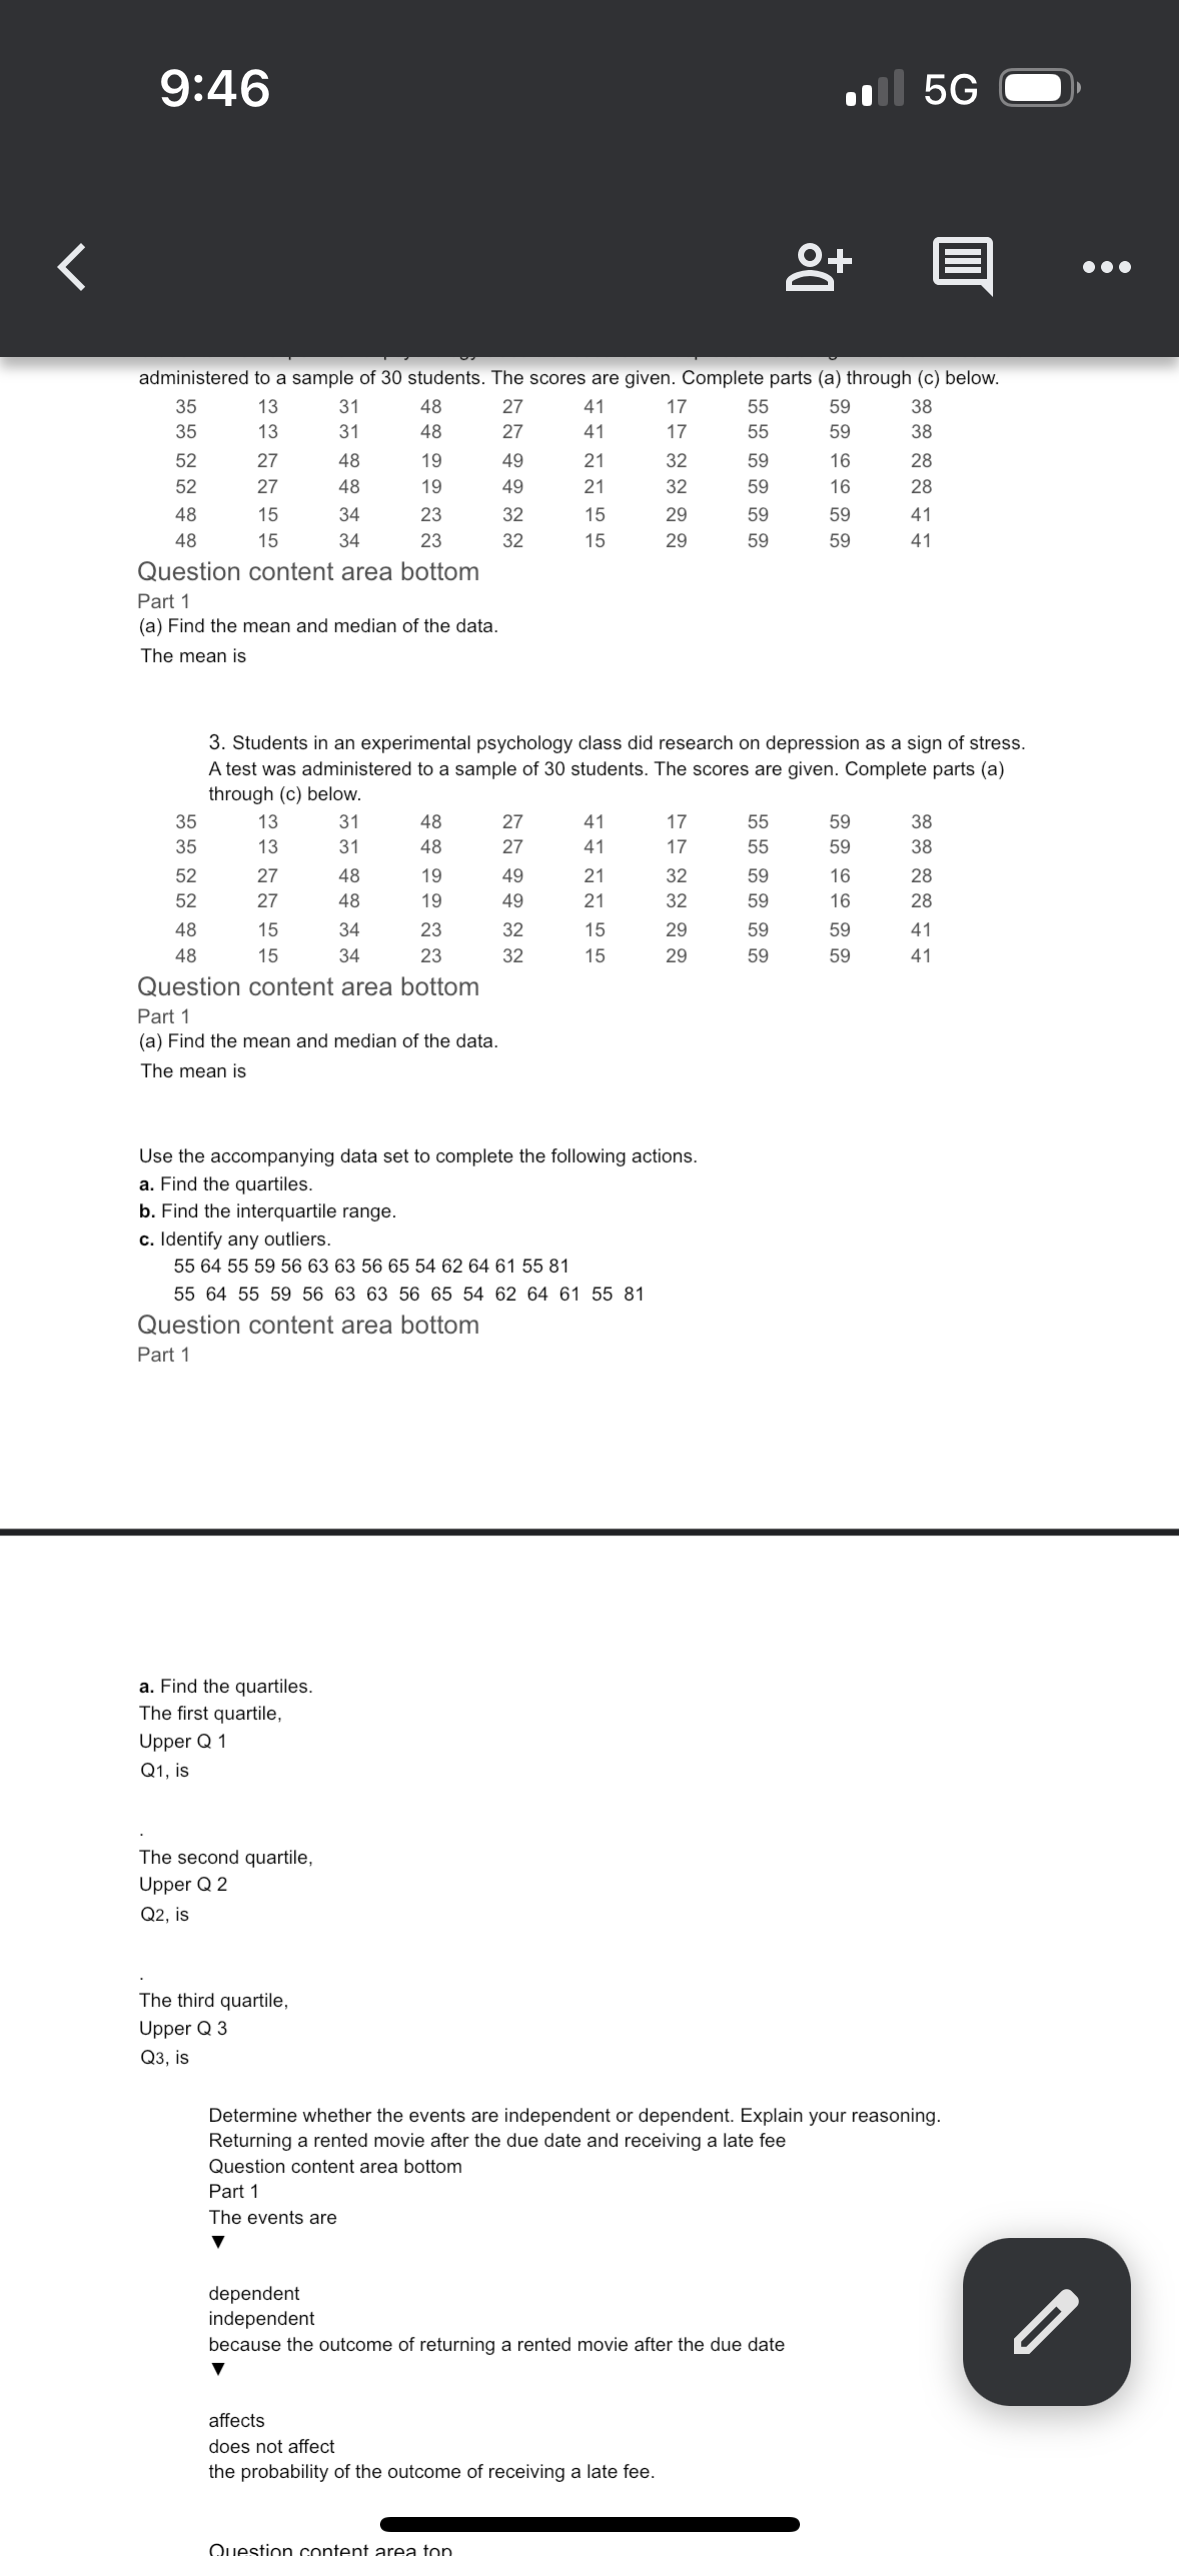
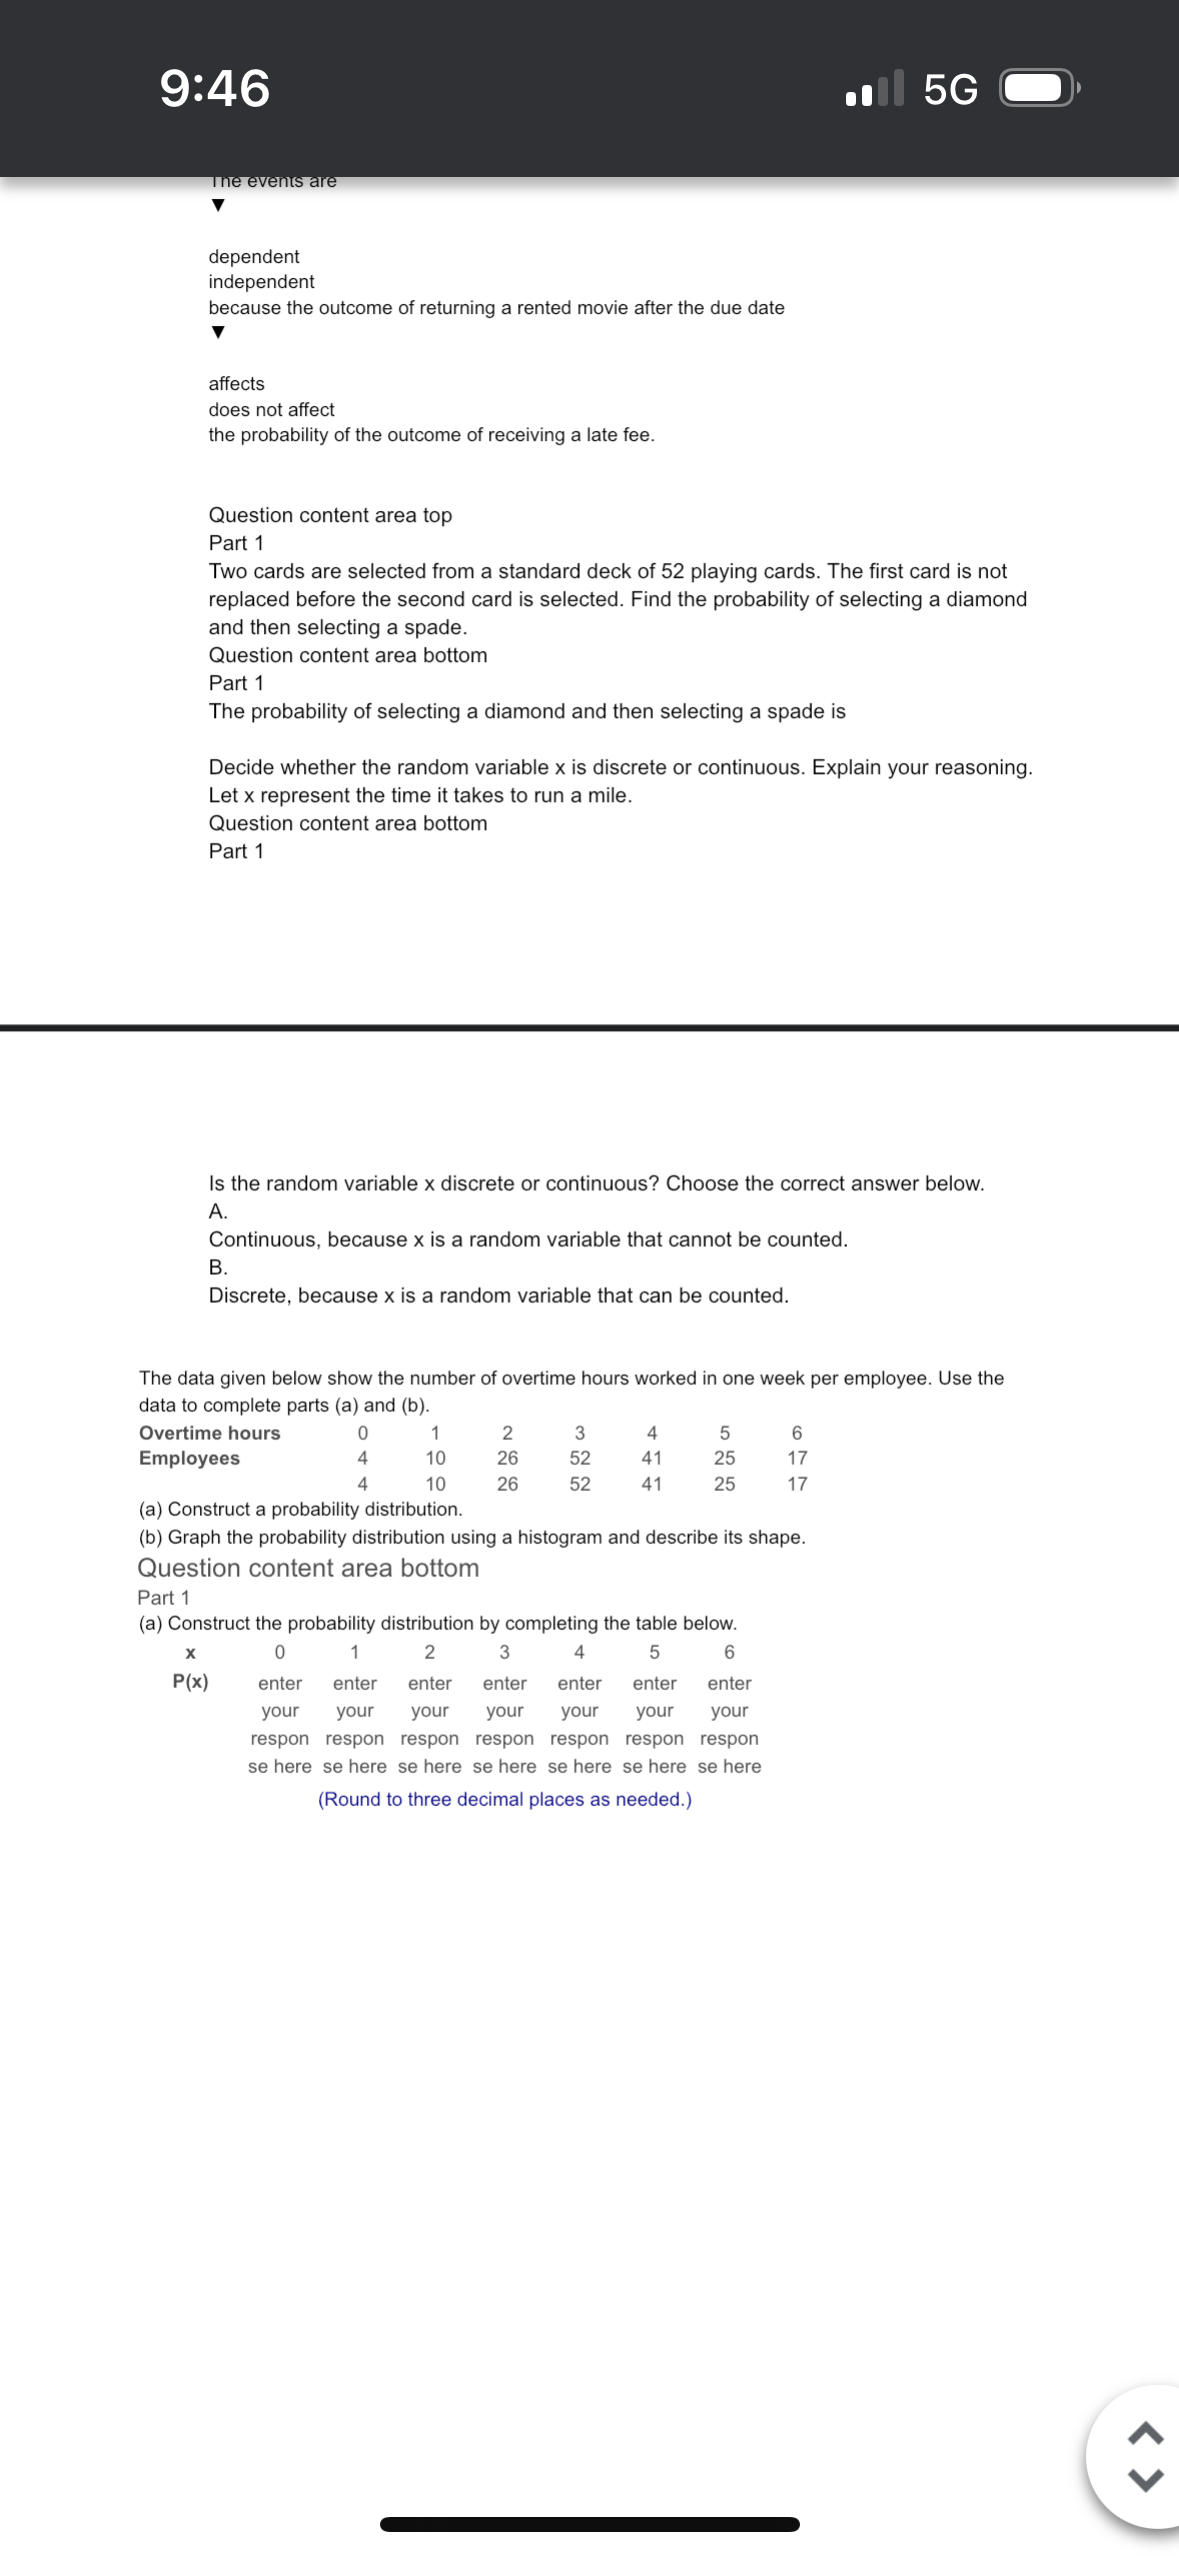
9:45 Il 5G +0 Question content area top Part 1 1. Use a stem-and-leaf plot to display the data, which represent the numbers of hours 24 nurses work per week. Describe any patterns. 46403038 36363232 32324040 3333 4 4 4 4 3 4 0 0 0 8 3 0 4 4 4 4 3 4 363 5 1 5 0 0 0 8 3 0 6 1 3 2 4 3 4 3 4 0 3 0 6 0 6 0 3 2 4 3 4 3 4 0 3 0 6 0 6 0 Question content area bottom Part 1 Determine the leaves in the stem-and-leaf plot below. Key: 3|3 equals =33 Hours worked 35355959 < > 2. Find the mean, median, and mode of the data, if possible. If any of these measures cannot be found or a measure does not represent the center of the data, explain why. The durations (in minutes) of power failures at a residence in the last 5 5 years are listed below. 11 166 67 79 67 79 772 17 79 46 5 17 79 46 11 562 52 52 37 28 37 28 5 F5F5 11 11 Question content area bottom Part 1 What is the mean duration? Select the correct choice below and fill in any answer box to complete your choice. A. The mean duration is enter your response here minutes. (Round to one decimal place as needed.) There is no mean score. Students in an experimental psychology class did research on depression as a sign of stress. A test was administered to a sample of 30 students. The scores are given. Complete parts (a) through (c) below. B. 35 13 31 48 27 41 35 13 31 48 27 41 52 27 48 19 49 21 32 52 27 48 19 49 21 48 15 34 23 32 15 48 15 34 23 32 32 15 7722229 17 55 59 38 17 55 59 38 59 16 28 32 59 16 28 59 59 41 59 59 59 41 Question content area bottom Part 1 (a) Find the mean and median of the data. The mean is 9:46 +0 Il 5G administered to a sample of 30 students. The scores are given. Complete parts (a) through (c) below. 35 13 31 48 27 35 13 31 48 27 41 52 27 48 19 49 52 27 48 19 49 48 15 34 23 32 48 15 34 23 32 ZZZZ55 41 21 21 15 29 15 222222 17 55 59 38 17 55 32 59 32 59 59 29 59 gg 59 38 16 28 16 28 59 41 59 41 Question content area bottom Part 1 (a) Find the mean and median of the data. The mean is 3. Students in an experimental psychology class did research on depression as a sign of stress. A test was administered to a sample of 30 students. The scores are given. Complete parts (a) through (c) below. 35 13 31 48 27 41 17 55 59 38 35 13 31 48 27 41 17 55 59 38 52 27 48 19 49 21 32 59 16 28 52 27 48 19 49 21 32 59 16 28 48 15 34 23 32 15 29 59 59 41 48 15 34 23 32 15 29 59 59 41 Question content area bottom Part 1 (a) Find the mean and median of the data. The mean is Use the accompanying data set to complete the following actions. a. Find the quartiles. b. Find the interquartile range. c. Identify any outliers. 55 64 55 59 56 63 63 56 65 54 62 64 61 55 81 55 64 55 59 56 63 63 56 65 54 62 64 61 55 81 Question content area bottom Part 1 a. Find the quartiles. The first quartile, Upper Q 1 Q1, is The second quartile, Upper Q2 Q2, is The third quartile, Upper Q 3 Q3, is Determine whether the events are independent or dependent. Explain your reasoning. Returning a rented movie after the due date and receiving a late fee Question content area bottom Part 1 The events are dependent independent because the outcome of returning a rented movie after the due date affects does not affect the probability of the outcome of receiving a late fee. Question content area ton 9:46 The events are dependent independent because the outcome of returning a rented movie after the due date affects does not affect the probability of the outcome of receiving a late fee. Il 5G Question content area top Part 1 Two cards are selected from a standard deck of 52 playing cards. The first card is not replaced before the second card is selected. Find the probability of selecting a diamond and then selecting a spade. Question content area bottom Part 1 The probability of selecting a diamond and then selecting a spade is Decide whether the random variable x is discrete or continuous. Explain your reasoning. Let x represent the time it takes to run a mile. Question content area bottom Part 1 Is the random variable x discrete or continuous? Choose the correct answer below. A. Continuous, because x is a random variable that cannot be counted. B. Discrete, because x is a random variable that can be counted. The data given below show the number of overtime hours worked in one week per employee. Use the data to complete parts (a) and (b). Overtime hours 0 1 Employees 4 10 4 10 2220 26 26 338 4 5 6 52 41 25 17 52 41 25 17 (a) Construct a probability distribution. (b) Graph the probability distribution using a histogram and describe its shape. Question content area bottom Part 1 (a) Construct the probability distribution by completing the table below. x 0 P(x) 1 2 3 4 5 6 enter enter enter enter enter enter enter your your your your your your your respon respon respon respon respon respon respon se here se here se here se here se here se here se here (Round to three decimal places as needed.) < >
Step by Step Solution
There are 3 Steps involved in it

Get step-by-step solutions from verified subject matter experts