

Question: ' '9th ll Ian: ........ B. This graph shows the heights of 1500 males. a. . a. What type of graph is this? 0-19 '
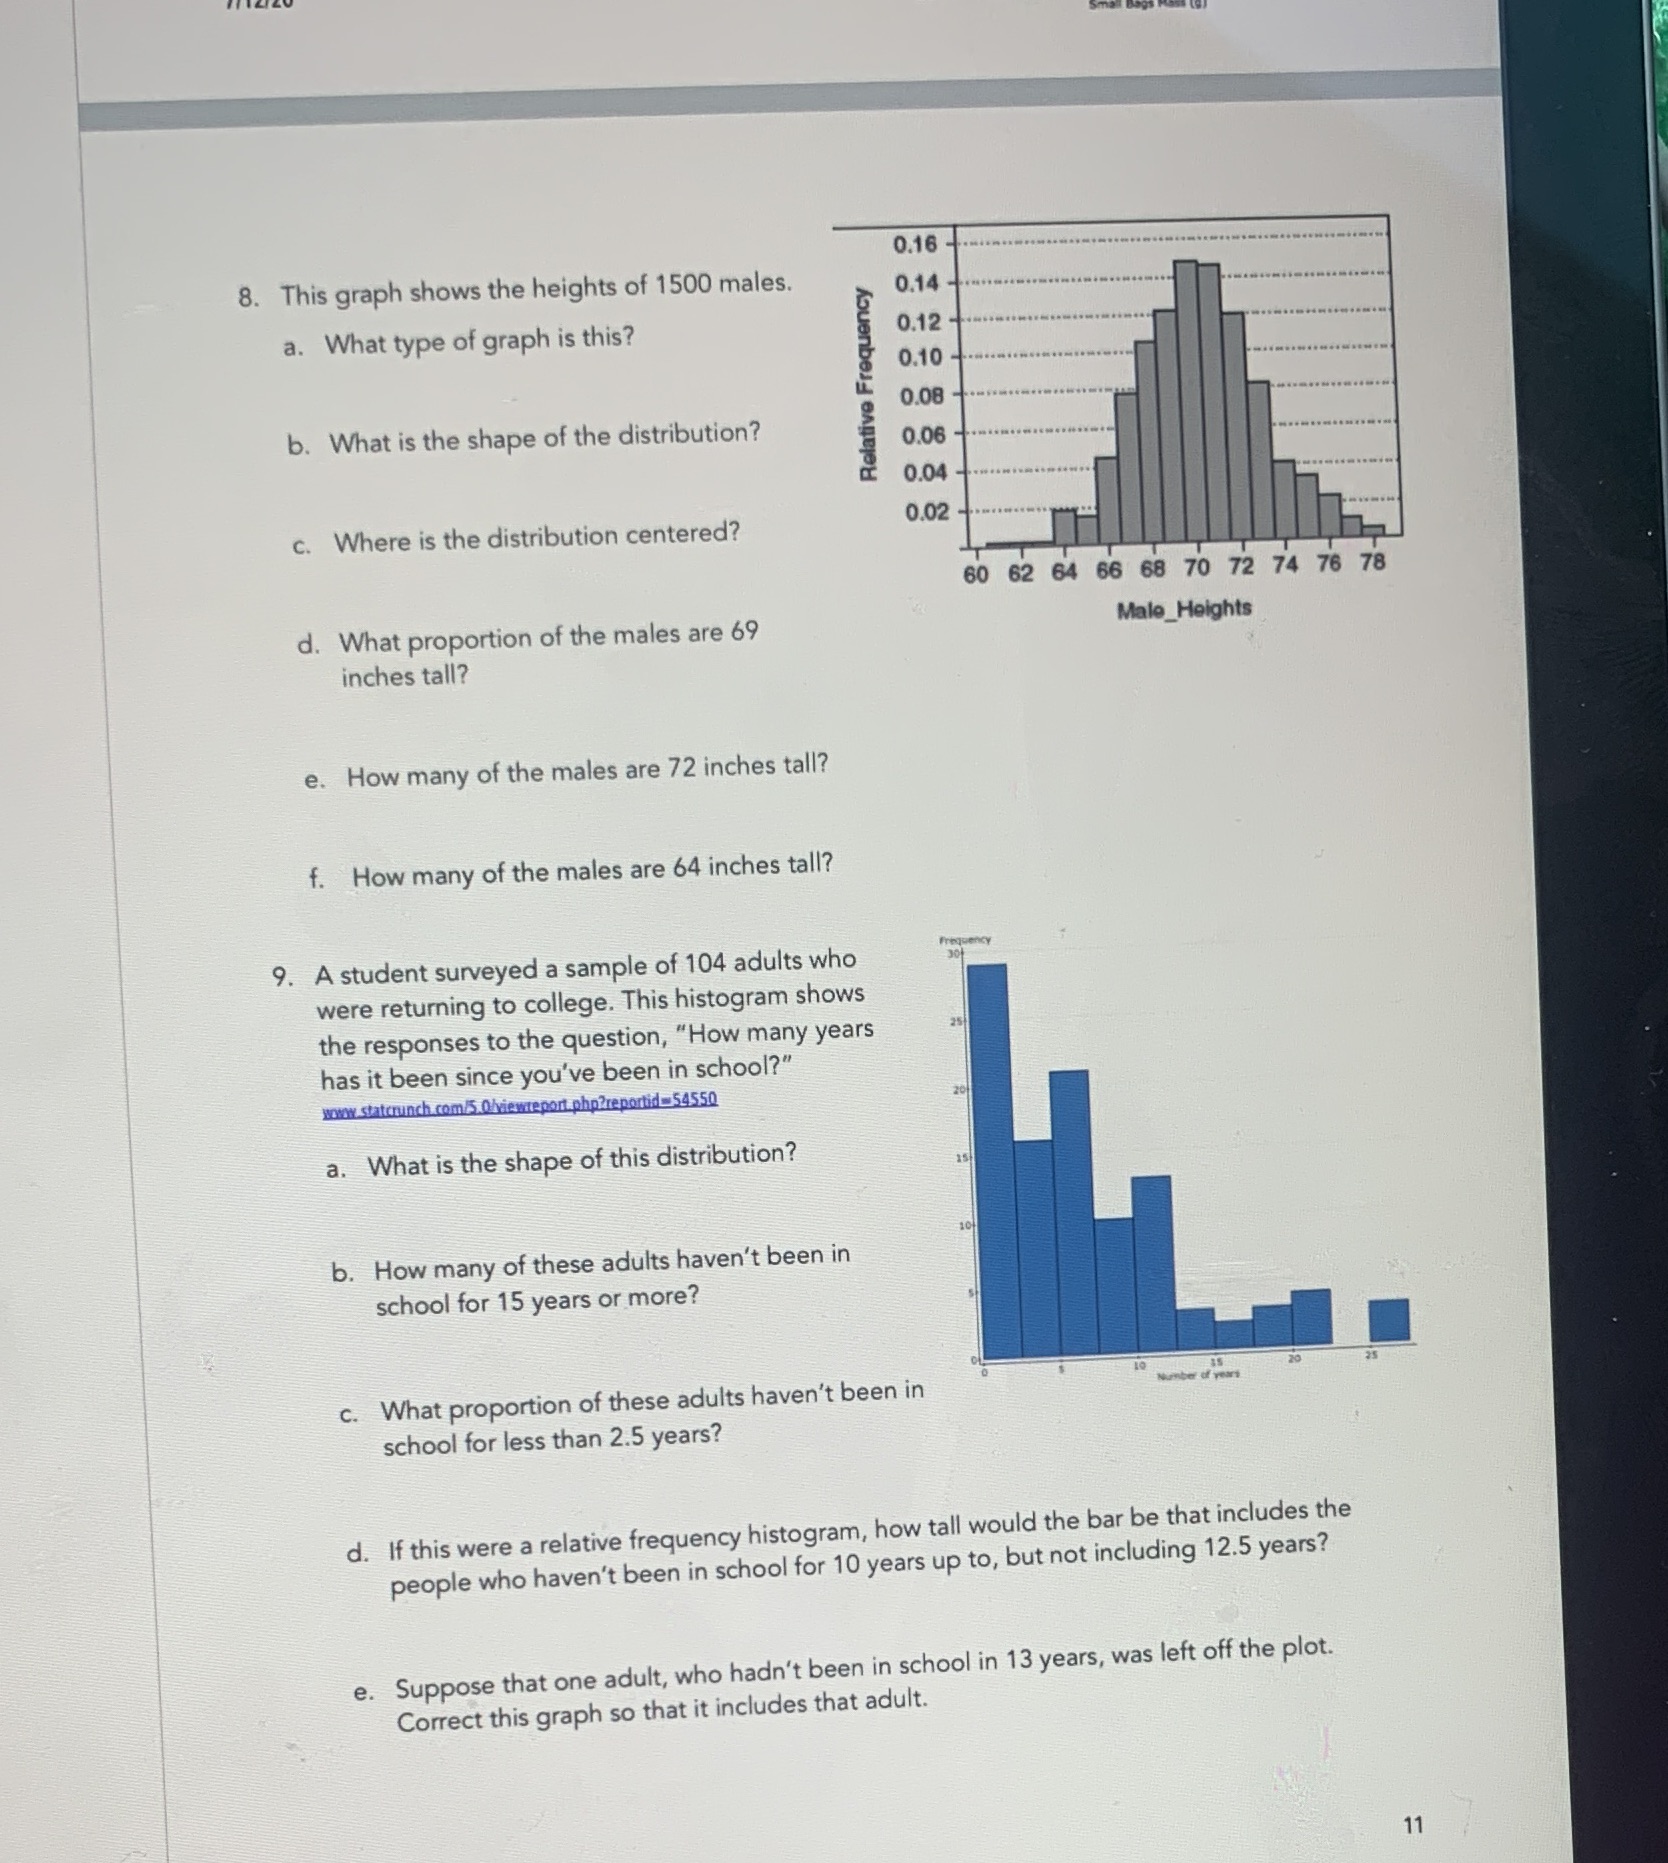
' '9th ll Ian: ........ B. This graph shows the heights of 1500 males. a.\" . a. What type of graph is this? 0-19 ' 0.10 on ' b. What is the shape of the distribution? i 0.00 . m .......... om .......... c. Where is the distribution centered? d. What proportion of the males are 69 inches tall? e. How many of the males are 72 inches tall? f. How many of the males are 64 inches tall? 9. A student surveyed a sample of 104 adults who were returning to college. This histogram shows the responses to the question, "How many years has it been since you've been in school?" - a. What is the shape of this distribution? b. How many of these adults haven't been in school for 15 years or more? c. What proportion of these adults haven't been in school for less than 2.5 years? d. lf this were a relative frequency histogram, how tall as Suppose that one adult, who hadn't been in school in 13 Correct this graph so that it includes that adult. wenuumnnnn Hut-Uh , would the bar be that includes the people who haven't been in school for 10 years up to, but not including 12.5 years? years, was left off the plot. 11
Step by Step Solution
There are 3 Steps involved in it

Get step-by-step solutions from verified subject matter experts