

Question: A . 1 A . IE 3 3 3 Data Science and Analytics - Fall 2 0 2 3 Principal Component Analysis Exercise: Let's apply
A AIE Data Science and Analytics Fall
Principal Component Analysis
Exercise:
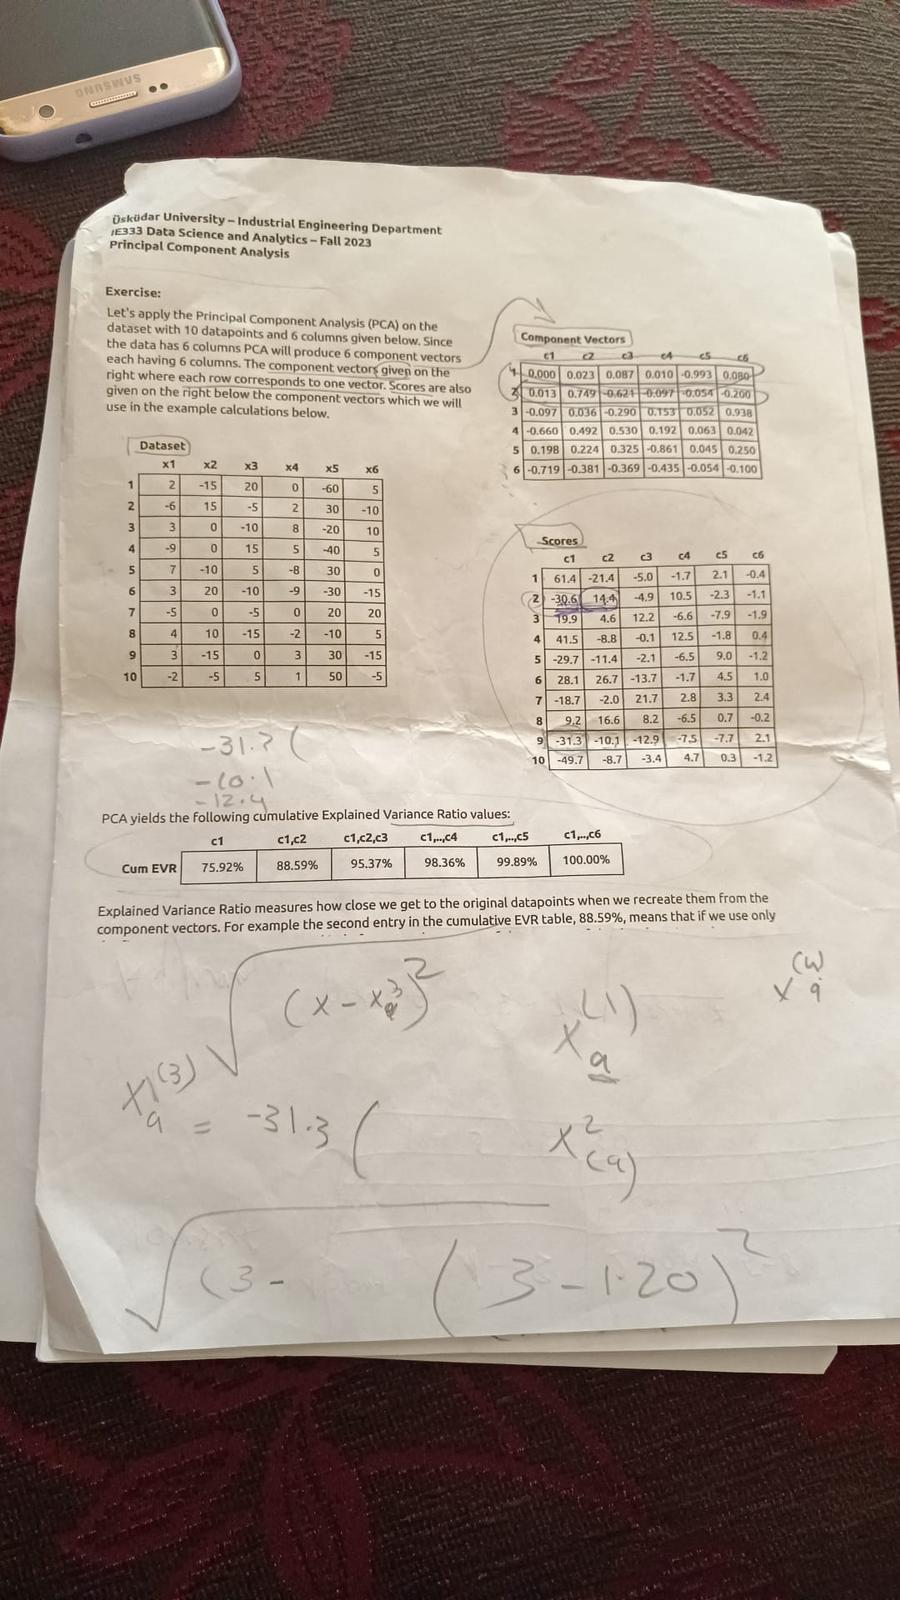
Let's apply the Principal Component Analysis PCA on the
dataset with datapoints and columns given below. Since
the data has columns PCA will produce component vectors
each having columns. The component vectors given on the
right where each row corresponds to one vector. Scores are also
given on the right below the component vectors which we will
use in the example calculations below.
Dataset
Scores
PCA yields the following cumulative Explained Variance Ratio values:
Explained Variance Ratio measures how close we get to the original datapoints when we recreate them from the
component vectors. For example the second entry in the cumulative EVR table, means that if we use only
Question
and
er
Step by Step Solution
There are 3 Steps involved in it
1 Expert Approved Answer
Step: 1 Unlock

Question Has Been Solved by an Expert!
Get step-by-step solutions from verified subject matter experts
Step: 2 Unlock
Step: 3 Unlock