

Question: A 1 B C Flagged Transactions D E F G H Situation: K L M 234567822222222222222222222222222222222 39 40 2 Customer ID 5468 Date Confirmed
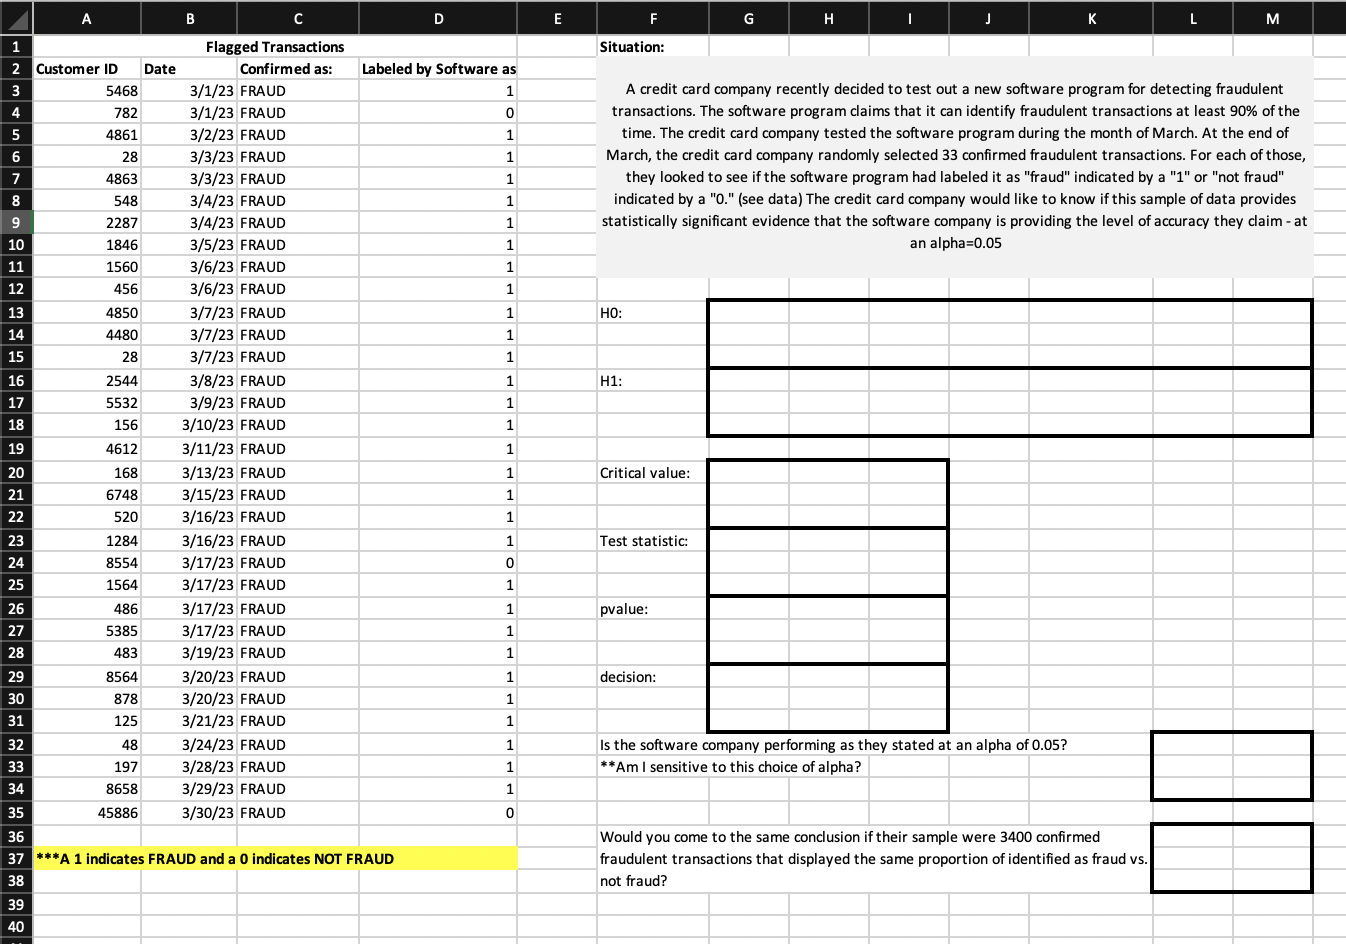
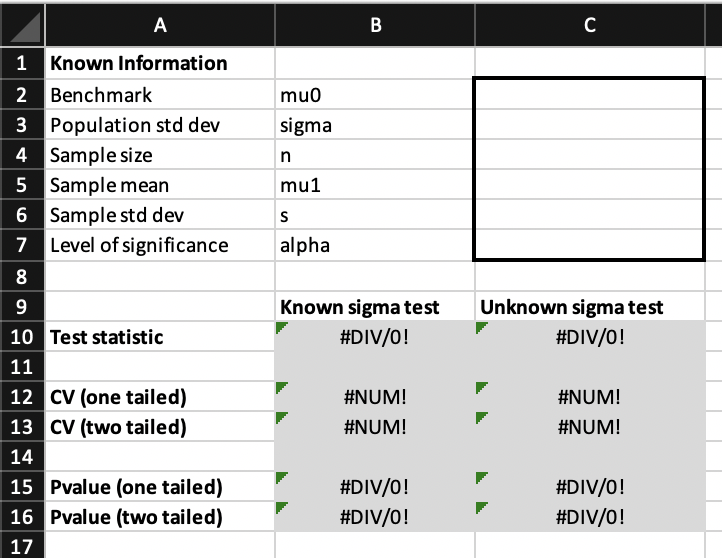
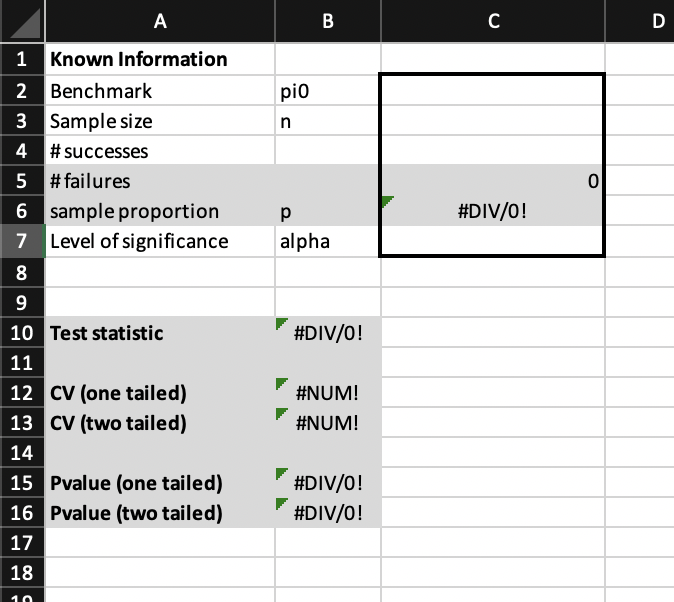
A 1 B C Flagged Transactions D E F G H Situation: K L M 234567822222222222222222222222222222222 39 40 2 Customer ID 5468 Date Confirmed as: Labeled by Software as 3/1/23 FRAUD 1 782 3/1/23 FRAUD 0 4861 3/2/23 FRAUD 1 28 3/3/23 FRAUD 1 4863 3/3/23 FRAUD 1 548 3/4/23 FRAUD 1 9 2287 3/4/23 FRAUD 1 10 1846 3/5/23 FRAUD 1 A credit card company recently decided to test out a new software program for detecting fraudulent transactions. The software program claims that it can identify fraudulent transactions at least 90% of the time. The credit card company tested the software program during the month of March. At the end of March, the credit card company randomly selected 33 confirmed fraudulent transactions. For each of those, they looked to see if the software program had labeled it as "fraud" indicated by a "1" or "not fraud" indicated by a "0." (see data) The credit card company would like to know if this sample of data provides statistically significant evidence that the software company is providing the level of accuracy they claim - at an alpha=0.05 11 1560 3/6/23 FRAUD 1 12 456 3/6/23 FRAUD 1 13 4850 3/7/23 FRAUD 1 HO: 14 4480 3/7/23 FRAUD 1 15 28 3/7/23 FRAUD 1 16 2544 3/8/23 FRAUD 1 H1: 17 5532 3/9/23 FRAUD 1 18 156 3/10/23 FRAUD 1 19 4612 3/11/23 FRAUD 1 20 168 3/13/23 FRAUD 1 Critical value: 21 6748 520 3/15/23 FRAUD 1 3/16/23 FRAUD 1 1284 3/16/23 FRAUD 1 Test statistic: 8554 3/17/23 FRAUD 0 1564 3/17/23 FRAUD 1 486 3/17/23 FRAUD 1 pvalue: 5385 3/17/23 FRAUD 1 483 3/19/23 FRAUD 1 29 8564 3/20/23 FRAUD 1 decision: 30 878 3/20/23 FRAUD 1 31 125 3/21/23 FRAUD 1 48 3/24/23 FRAUD 1 33 197 3/28/23 FRAUD 1 Is the software company performing as they stated at an alpha of 0.05? **Am I sensitive to this choice of alpha? 8658 3/29/23 FRAUD 1 45886 3/30/23 FRAUD 0 37 ***A 1 indicates FRAUD and a 0 indicates NOT FRAUD Would you come to the same conclusion if their sample were 3400 confirmed fraudulent transactions that displayed the same proportion of identified as fraud vs. not fraud? 2 3 A 1 Known Information Benchmark Population std dev B C mu0 sigma 4 Sample size n 5 Sample mean mu1 6 Sample std dev S 7 Level of significance alpha 8 9 10 Test statistic Known sigma test #DIV/O! Unknown sigma test #DIV/O! 11 12 CV (one tailed) #NUM! #NUM! 13 CV (two tailed) #NUM! #NUM! 14 15 Pvalue (one tailed) #DIV/O! #DIV/O! 16 Pvalue (two tailed) #DIV/O! #DIV/O! 17 A 1 Known Information 2 Benchmark 3 Sample size 4 #successes pio n B C D 5 #failures 6 sample proportion 0 #DIV/O! 7 Level of significance alpha 8 9 10 Test statistic #DIV/O! 11 12 CV (one tailed) #NUM! 13 CV (two tailed) #NUM! 14 15 Pvalue (one tailed) #DIV/O! 16 Pvalue (two tailed) #DIV/O! 17 18 10
Step by Step Solution
There are 3 Steps involved in it

Get step-by-step solutions from verified subject matter experts