

Question: A 1 - D oedometer ( consolidation ) test data is given below. The consolidation pressure is selected as v ' = 1 0 0
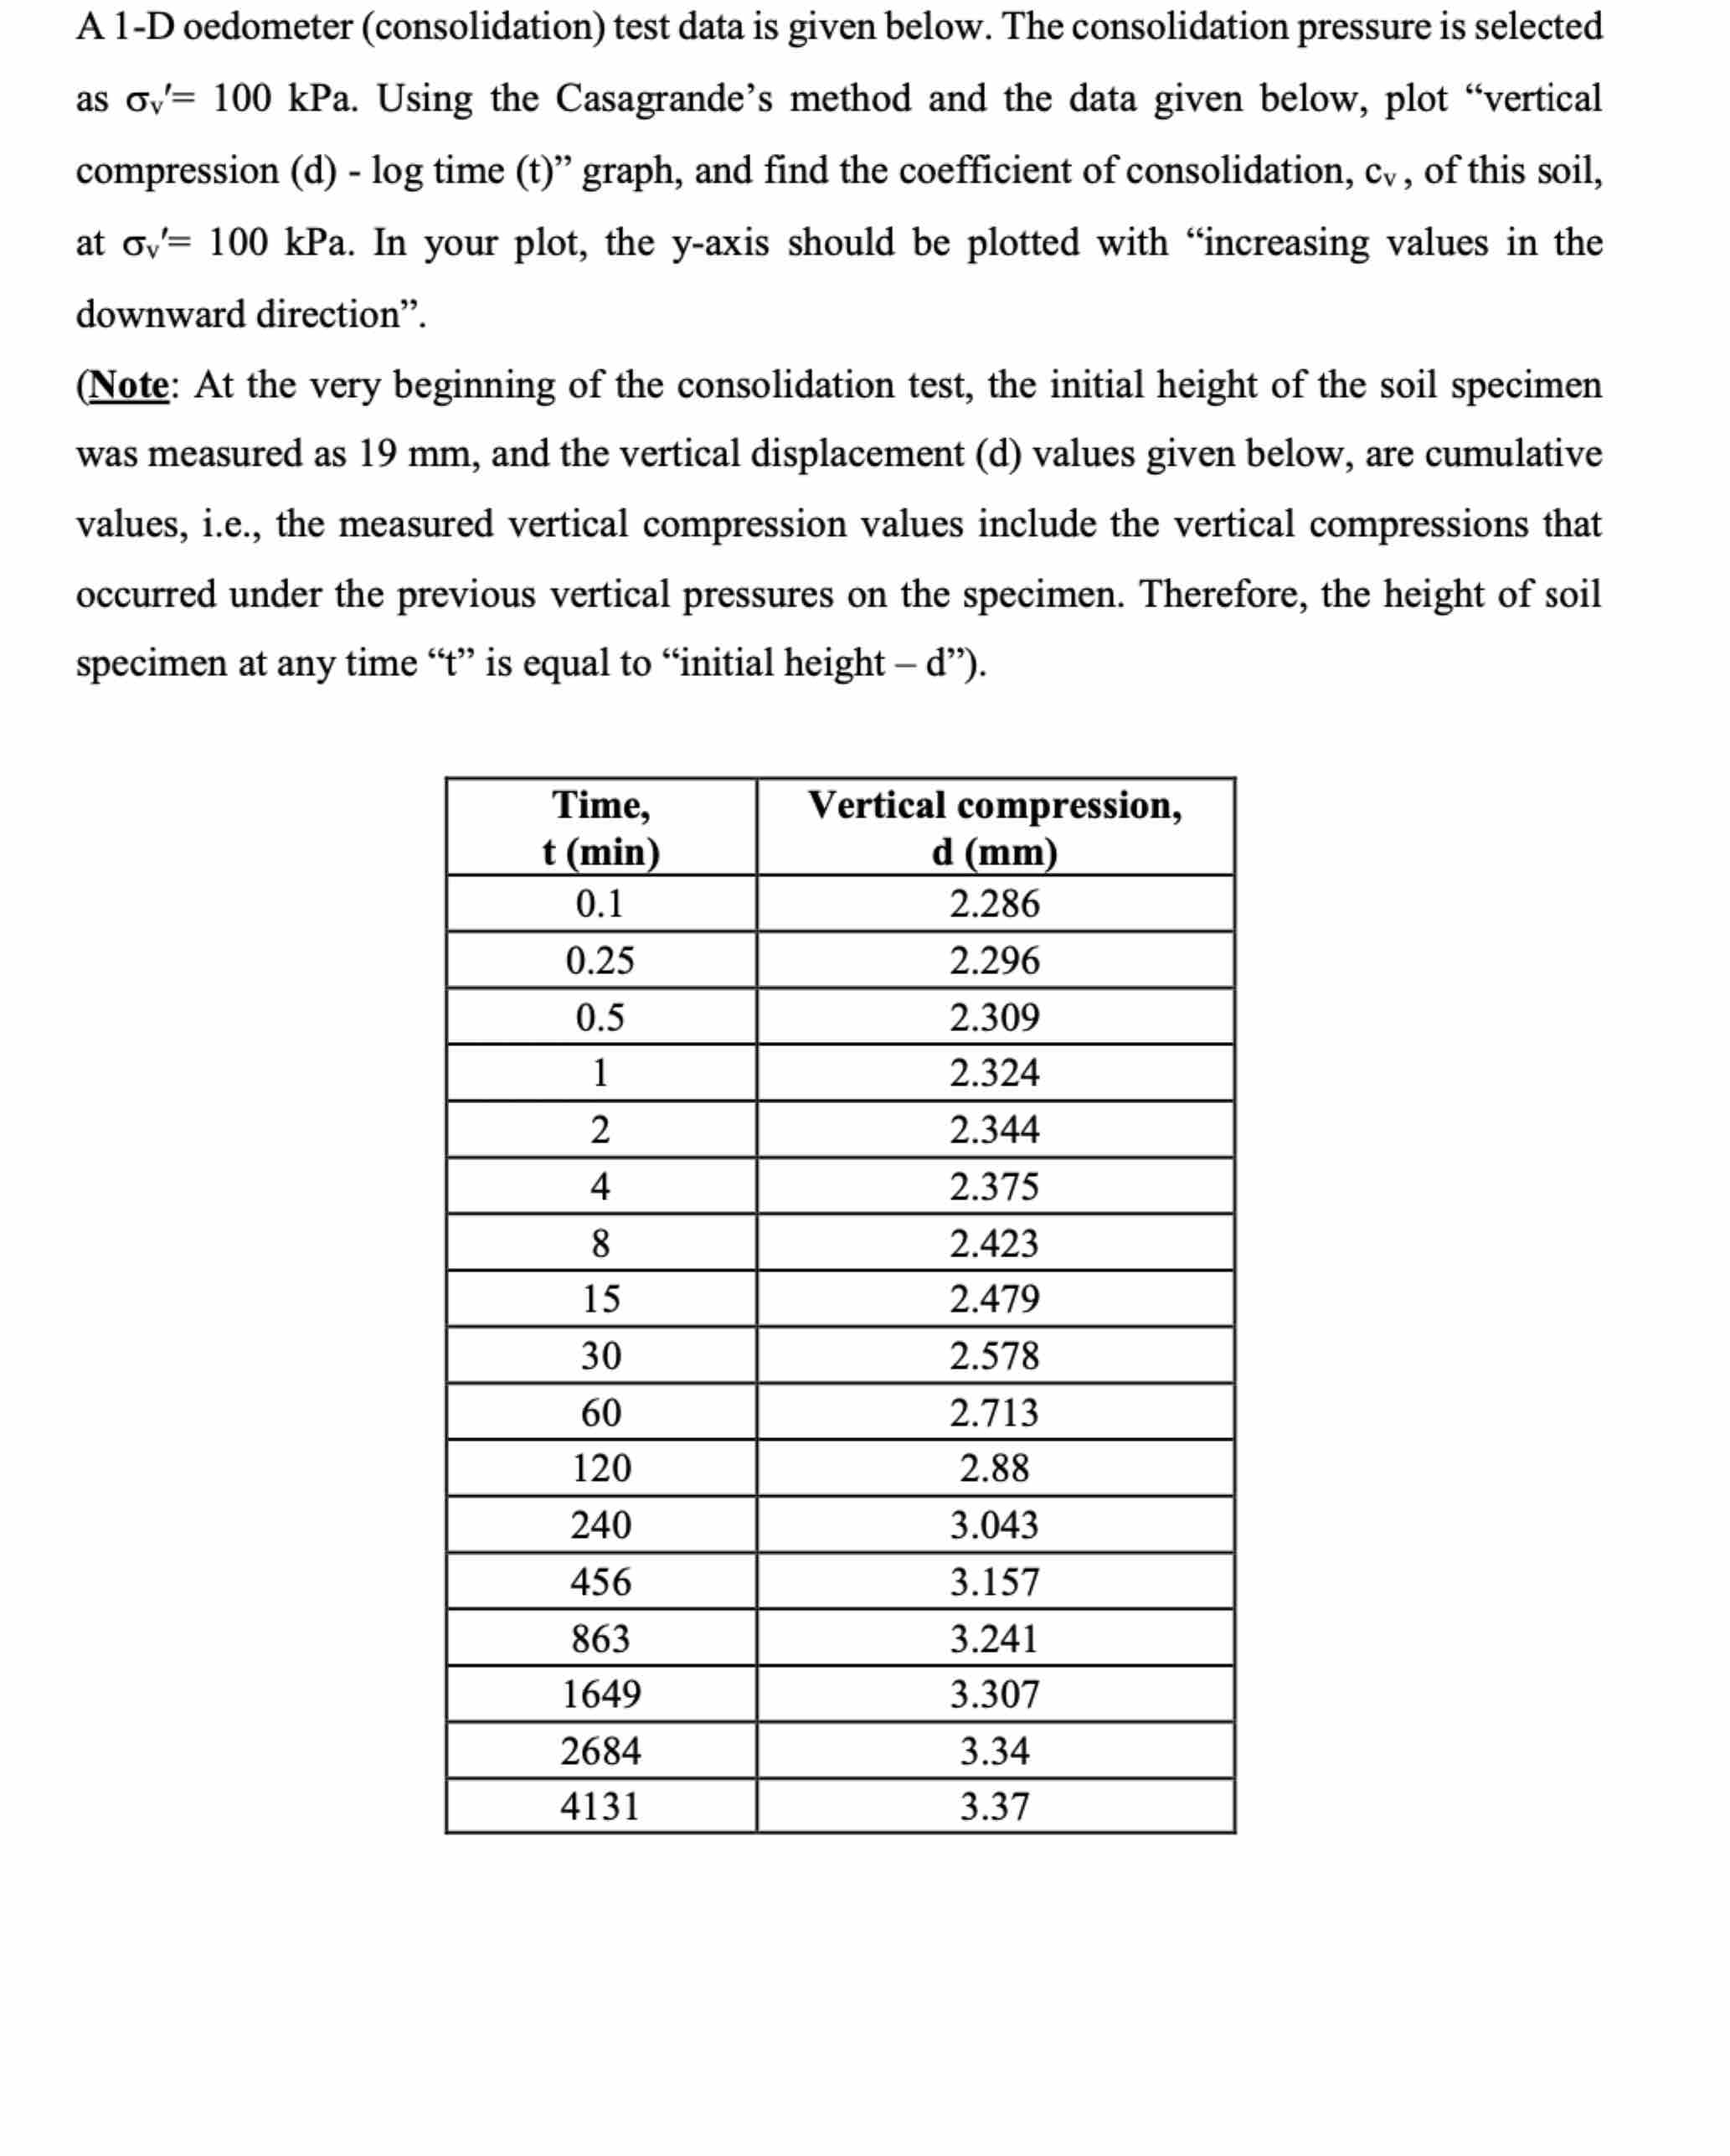
A D oedometer consolidation test data is given below. The consolidation pressure is selected
as kPa. Using the Casagrande's method and the data given below, plot "vertical
compression d log time t graph, and find the coefficient of consolidation, of this soil,
at kPa. In your plot, the yaxis should be plotted with "increasing values in the
downward direction".
Note: At the very beginning of the consolidation test, the initial height of the soil specimen
was measured as and the vertical displacement d values given below, are cumulative
values, ie the measured vertical compression values include the vertical compressions that
occurred under the previous vertical pressures on the specimen. Therefore, the height of soil
specimen at any time is equal to "initial height
Step by Step Solution
There are 3 Steps involved in it
1 Expert Approved Answer
Step: 1 Unlock

Question Has Been Solved by an Expert!
Get step-by-step solutions from verified subject matter experts
Step: 2 Unlock
Step: 3 Unlock