

Question: A 1 Introduction 2 3 4 5 6 7 B D E F G H The Significant Relative Yield (SRY) model offers insights into
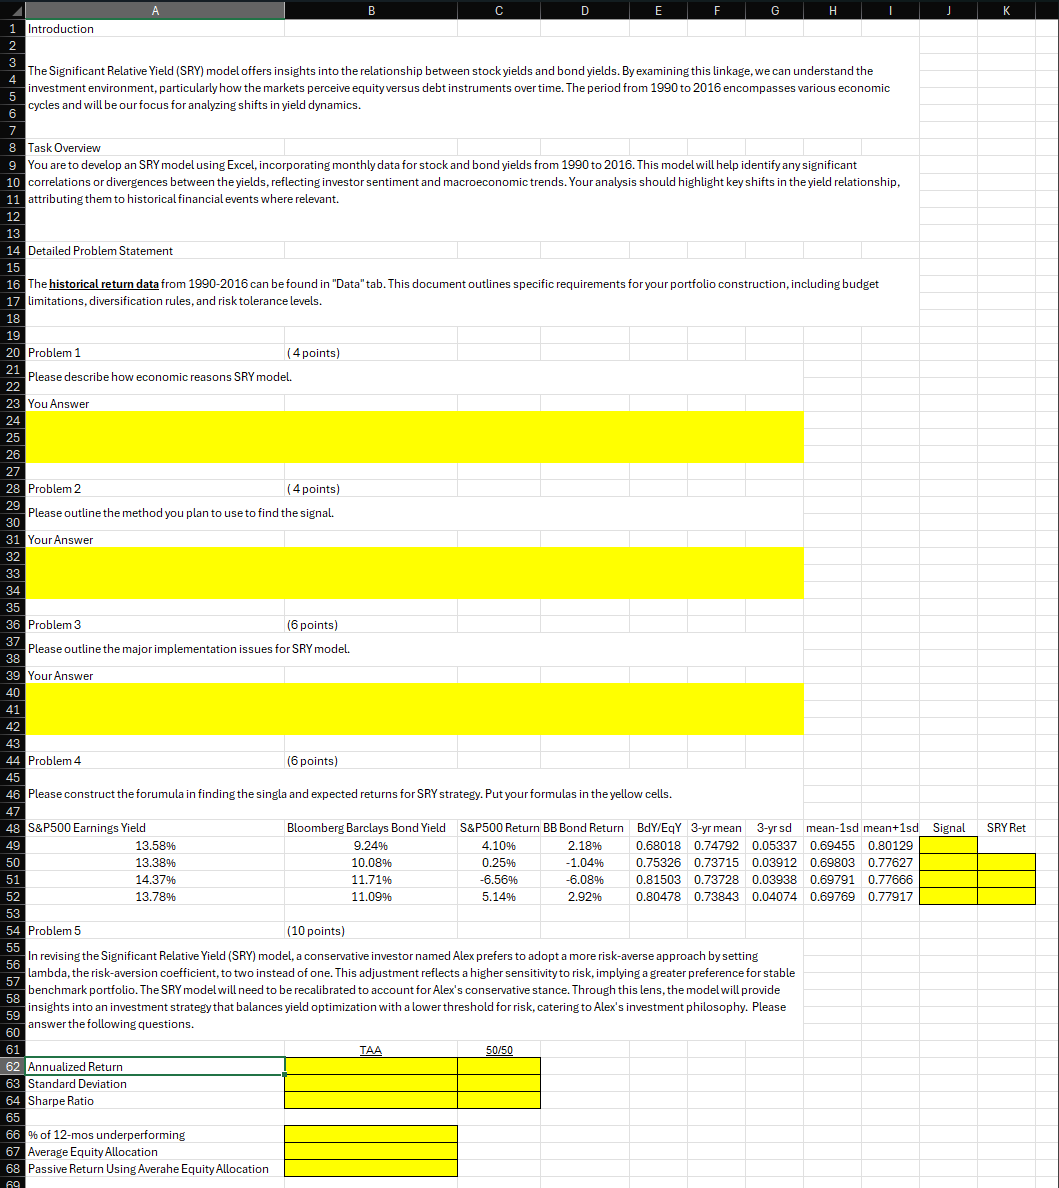
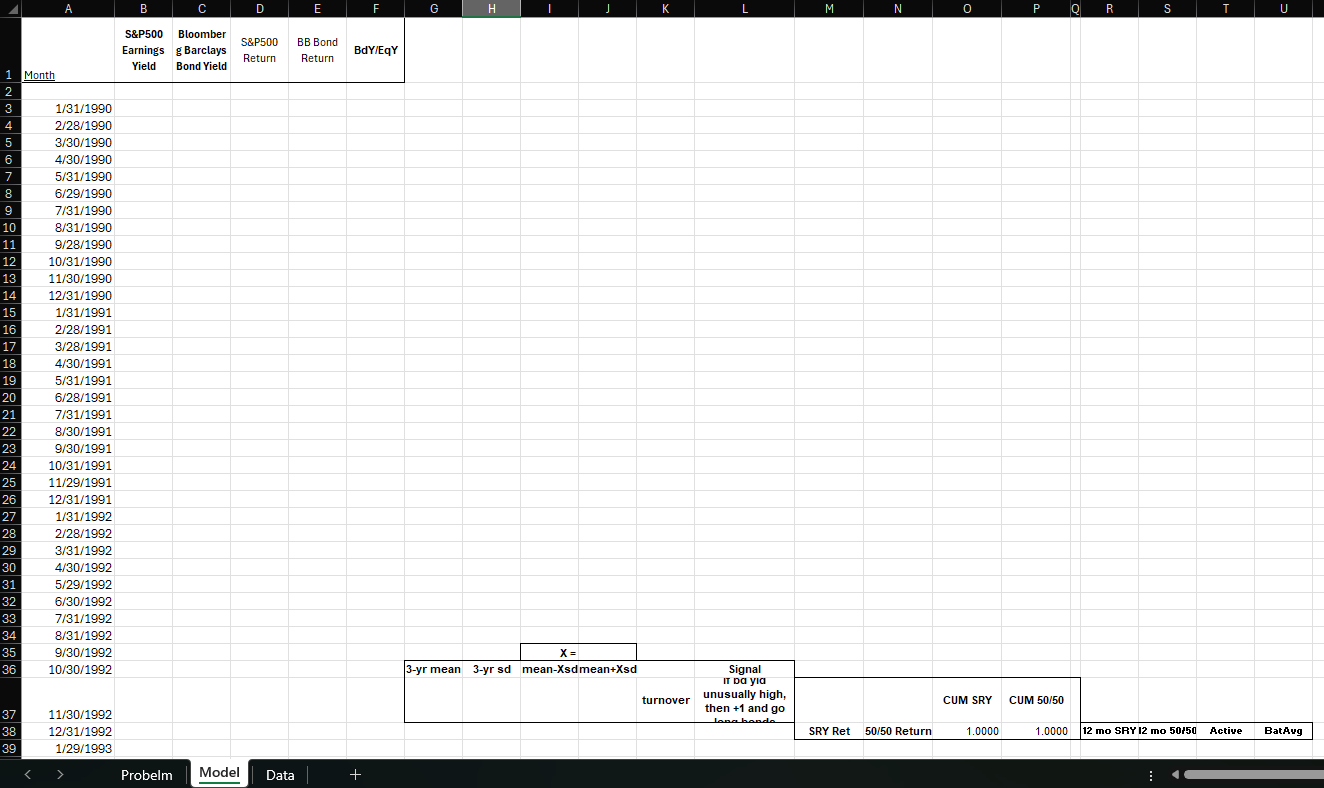
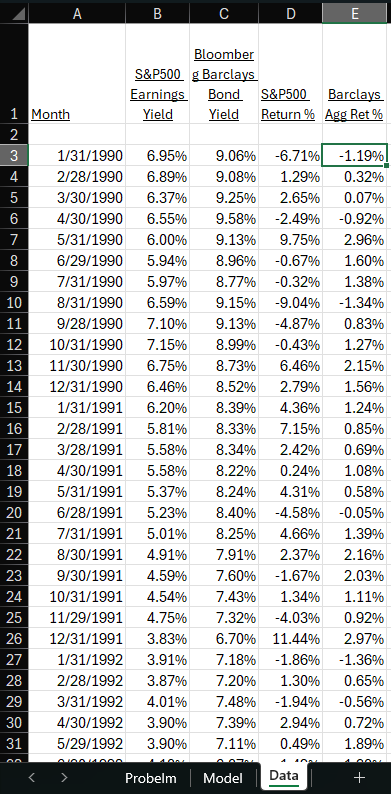
A 1 Introduction 2 3 4 5 6 7 B D E F G H The Significant Relative Yield (SRY) model offers insights into the relationship between stock yields and bond yields. By examining this linkage, we can understand the investment environment, particularly how the markets perceive equity versus debt instruments over time. The period from 1990 to 2016 encompasses various economic cycles and will be our focus for analyzing shifts in yield dynamics. 8 Task Overview 9 You are to develop an SRY model using Excel, incorporating monthly data for stock and bond yields from 1990 to 2016. This model will help identify any significant 10 correlations or divergences between the yields, reflecting investor sentiment and macroeconomic trends. Your analysis should highlight key shifts in the yield relationship, 11 attributing them to historical financial events where relevant. 12 13 14 Detailed Problem Statement 15 16 The historical return data from 1990-2016 can be found in "Data" tab. This document outlines specific requirements for your portfolio construction, including budget 17 limitations, diversification rules, and risk tolerance levels. 18 19 20 Problem 1 (4 points) 21 Please describe how economic reasons SRY model. 22 23 You Answer 24 25 26 27 28 Problem 2 (4 points) 29 Please outline the method you plan to use to find the signal. 30 31 Your Answer 32 33 34 35 36 Problem 3 (6 points) 37 Please outline the major implementation issues for SRY model. 38 39 Your Answer 40 41 42 43 K 44 Problem 4 (6 points) 45 46 Please construct the forumula in finding the singla and expected returns for SRY strategy. Put your formulas in the yellow cells. 47 48 S&P500 Earnings Yield Bloomberg Barclays Bond Yield S&P500 Return BB Bond Return 49 13.58% 9.24% 4.10% 50 13.38% 10.08% 51 14.37% 11.71% 52 13.78% 11.09% 0.25% -6.56% 5.14% 2.18% -1.04% -6.08% 2.92% BdY/EqY 3-yr mean 3-yr sd mean-1sd mean+1sd Signal 0.68018 0.74792 0.05337 0.69455 0.80129 0.75326 0.73715 0.03912 0.69803 0.77627 0.81503 0.73728 0.03938 0.69791 0.77666 0.80478 0.73843 0.04074 0.69769 0.77917 SRY Ret 53 54 Problem 5 (10 points) 55 56 57 58 59 In revising the Significant Relative Yield (SRY) model, a conservative investor named Alex prefers to adopt a more risk-averse approach by setting lambda, the risk-aversion coefficient, to two instead of one. This adjustment reflects a higher sensitivity to risk, implying a greater preference for stable benchmark portfolio. The SRY model will need to be recalibrated to account for Alex's conservative stance. Through this lens, the model will provide insights into an investment strategy that balances yield optimization with a lower threshold for risk, catering to Alex's investment philosophy. Please answer the following questions. 60 61 TAA 50/50 62 Annualized Return 63 Standard Deviation 64 Sharpe Ratio 65 66 % of 12-mos underperforming 67 Average Equity Allocation 68 Passive Return Using Averahe Equity Allocation 69 1 Month A B S&P500 2 3 1/31/1990 4 2/28/1990 5 3/30/1990 6 4/30/1990 7 5/31/1990 8 6/29/1990 9 7/31/1990 10 8/31/1990 11 9/28/1990 12 10/31/1990 13 11/30/1990 14 12/31/1990 15 1/31/1991 16 2/28/1991 17 3/28/1991 18 4/30/1991 19 5/31/1991 20 6/28/1991 21 7/31/1991 22 8/30/1991 23 9/30/1991 24 10/31/1991 25 11/29/1991 26 12/31/1991 2223333333 27 1/31/1992 28 2/28/1992 29 3/31/1992 30 4/30/1992 31 5/29/1992 6/30/1992 7/31/1992 34 8/31/1992 35 9/30/1992 36 10/30/1992 Bloomber DE S&P500 Earnings g Barclays Return Yield Bond Yield BB Bond Return F H K M N P R S T U BdY/EqY 37 11/30/1992 38 12/31/1992 39 1/29/1993 > Probelm Model Data + x= 3-yr mean 3-yr sd mean-Xsdmean+Xsd turnover Signal IT Da yia unusually high, then +1 and go Jona bondo CUM SRY CUM 50/50 SRY Ret 50/50 Return 1.0000 1.0000 12 mo SRY 12 mo 50/50 Active BatAvg A B D E Bloomber S&P500 g Barclays Earnings Bond S&P500 Barclays 1 Month Yield Yield Return % Agg Ret % 2 3 1/31/1990 6.95% 9.06% -6.71% -1.19% 4 2/28/1990 6.89% 9.08% 1.29% 0.32% 5 3/30/1990 6.37% 9.25% 2.65% 0.07% 6 4/30/1990 6.55% 9.58% -2.49% -0.92% 7 5/31/1990 6.00% 9.13% 9.75% 2.96% 8 6/29/1990 5.94% 8.96% -0.67% 1.60% 9 7/31/1990 5.97% 8.77% -0.32% 1.38% 10 8/31/1990 6.59% 9.15% -9.04% -1.34% 11 9/28/1990 7.10% 9.13% -4.87% 0.83% 12 10/31/1990 7.15% 8.99% -0.43% 1.27% 13 11/30/1990 6.75% 8.73% 6.46% 2.15% 14 12/31/1990 6.46% 8.52% 2.79% 1.56% 15 1/31/1991 6.20% 8.39% 4.36% 1.24% 16 2/28/1991 5.81% 8.33% 7.15% 0.85% 17 3/28/1991 5.58% 8.34% 2.42% 0.69% 18 4/30/1991 5.58% 8.22% 0.24% 1.08% 19 5/31/1991 5.37% 8.24% 4.31% 0.58% 20 21 6/28/1991 7/31/1991 5.01% 5.23% 8.40% -4.58% -0.05% 8.25% 4.66% 1.39% 22 8/30/1991 4.91% 7.91% 2.37% 2.16% 23 9/30/1991 4.59% 7.60% -1.67% 2.03% 24 10/31/1991 4.54% 7.43% 1.34% 1.11% 25 11/29/1991 4.75% 7.32% -4.03% 0.92% 26 12/31/1991 3.83% 6.70% 11.44% 2.97% 27 1/31/1992 3.91% 7.18% -1.86% -1.36% 28 2/28/1992 3.87% 7.20% 1.30% 0.65% 29 3/31/1992 4.01% 7.48% -1.94% -0.56% 30 31 4/30/1992 3.90% 5/29/1992 3.90% 7.39% 2.94% 0.72% 7.11% 0.49% 1.89% Probelm Model Data +
Step by Step Solution
There are 3 Steps involved in it

Get step-by-step solutions from verified subject matter experts