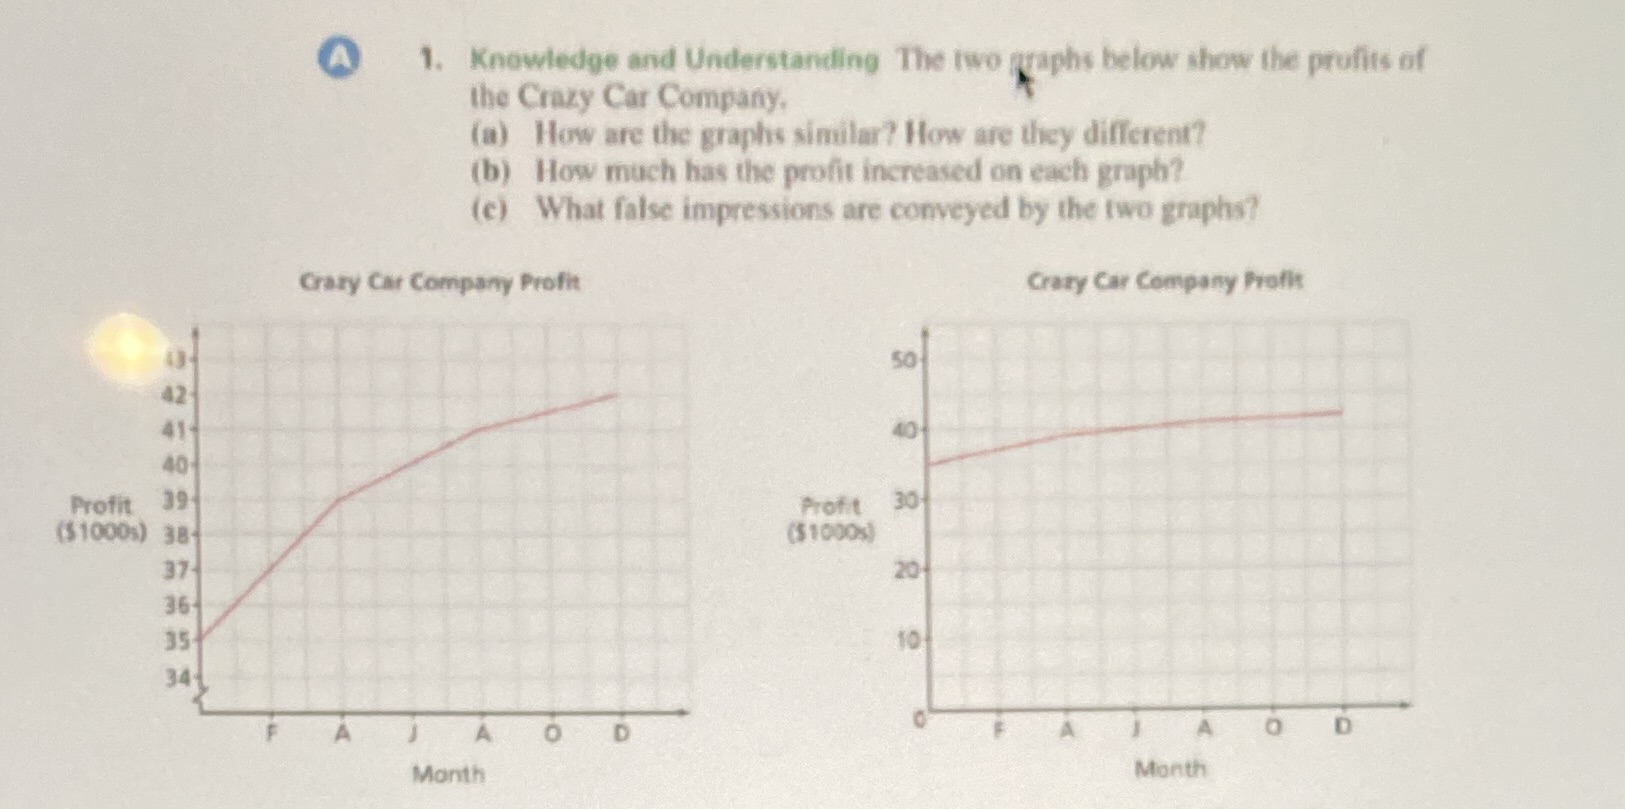
Question: A 1. Knowledge and Understanding The two graphs below show the profits of the Crazy Car Company. (a) How are the graphs similar? How are

A 1. Knowledge and Understanding The two graphs
A 1. Knowledge and Understanding The two graphs below show the profits of the Crazy Car Company. (a) How are the graphs similar? How are they different? (b) How much has the profit increased on each graph? (e) What false impressions are conveyed by the two graphs? Crary Car Company Profit Crazy Car Company Profit 50 40 Profit Profit 30 ($1000s) 38 ($1000%) 37- 20 36 35 10 34 A D A D Month Month

Step by Step Solution

There are 3 Steps involved in it

1 Expert Approved Answer
Step: 1 Unlock blur-text-image
Question Has Been Solved by an Expert!

Get step-by-step solutions from verified subject matter experts

Step: 2 Unlock
Step: 3 Unlock

Students Have Also Explored These Related Mathematics Questions!