

Question: A 1 Stock Data B C D E F G H J K L M N 0 5. The Excel file Stock Data contains
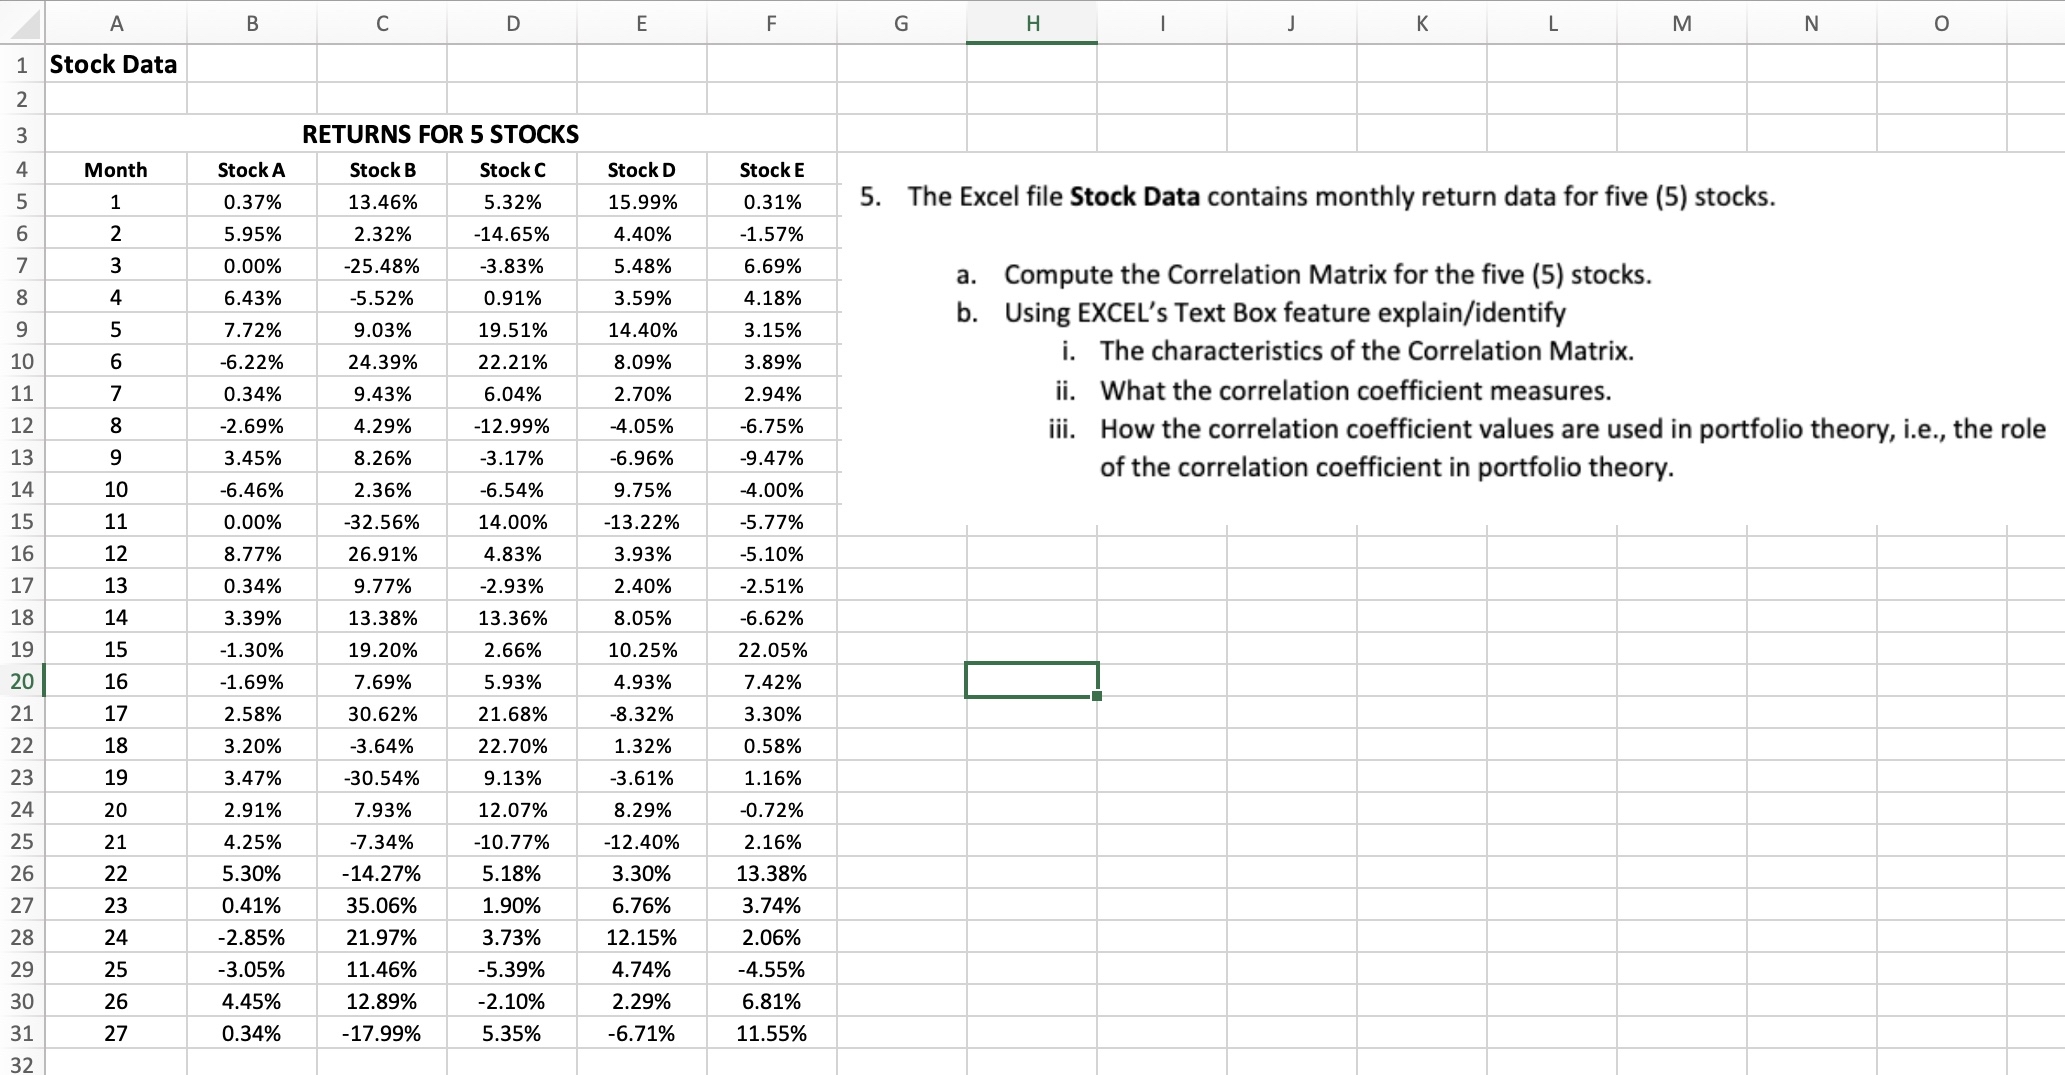
A 1 Stock Data B C D E F G H J K L M N 0 5. The Excel file Stock Data contains monthly return data for five (5) stocks. a. Compute the Correlation Matrix for the five (5) stocks. b. Using EXCEL's Text Box feature explain/identify i. The characteristics of the Correlation Matrix. ii. What the correlation coefficient measures. iii. How the correlation coefficient values are used in portfolio theory, i.e., the role of the correlation coefficient in portfolio theory. 2 3 RETURNS FOR 5 STOCKS 4 5 Month 1 Stock A Stock B Stock C Stock D Stock E 0.37% 13.46% 5.32% 15.99% 0.31% 6 7 8 9 10 234561 5.95% 2.32% -14.65% 4.40% -1.57% 0.00% 6.43% 7.72% -25.48% -3.83% 5.48% 6.69% -5.52% 0.91% 3.59% 4.18% 9.03% 19.51% 14.40% 3.15% -6.22% 24.39% 22.21% 8.09% 3.89% 11 7 0.34% 9.43% 6.04% 2.70% 2.94% 12 8 -2.69% 4.29% -12.99% -4.05% -6.75% 13 9 3.45% 8.26% -3.17% -6.96% -9.47% 14 10 -6.46% 2.36% -6.54% 9.75% -4.00% 15 11 0.00% -32.56% 14.00% -13.22% -5.77% 16 12 8.77% 26.91% 4.83% 3.93% -5.10% 17 13 0.34% 9.77% -2.93% 2.40% -2.51% 18 14 3.39% 13.38% 13.36% 8.05% -6.62% 19 15 -1.30% 19.20% 2.66% 10.25% 22.05% 20 16 -1.69% 7.69% 5.93% 4.93% 7.42% 21 17 2.58% 30.62% 21.68% -8.32% 3.30% 22 18 3.20% -3.64% 22.70% 1.32% 0.58% 23 19 3.47% -30.54% 9.13% -3.61% 1.16% 24 20 2.91% 7.93% 12.07% 8.29% -0.72% 25 21 4.25% -7.34% -10.77% -12.40% 2.16% 26 22 5.30% -14.27% 5.18% 3.30% 13.38% 27 23 0.41% 35.06% 1.90% 6.76% 3.74% 28 24 29 25 30 26 31 27 4567 -2.85% 21.97% 3.73% 12.15% 2.06% -3.05% 11.46% -5.39% 4.74% -4.55% 4.45% 12.89% -2.10% 2.29% 6.81% 0.34% -17.99% 5.35% -6.71% 11.55% 32
Step by Step Solution
There are 3 Steps involved in it

Get step-by-step solutions from verified subject matter experts