

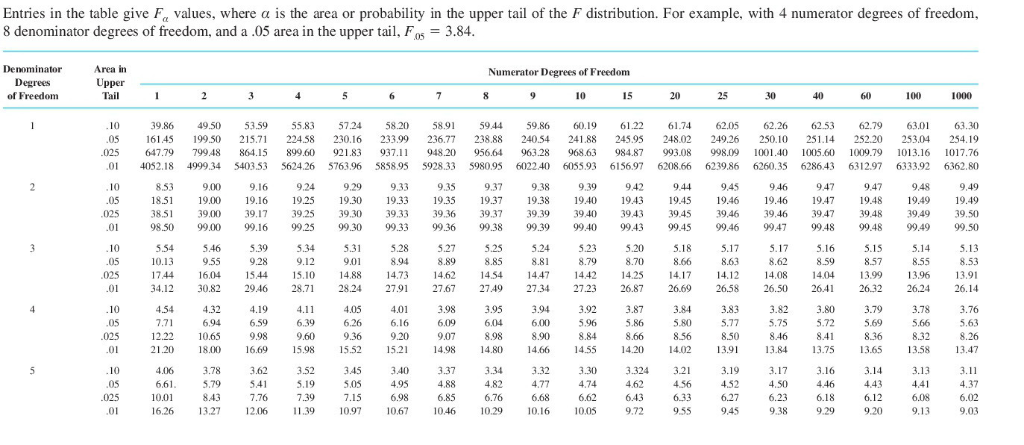
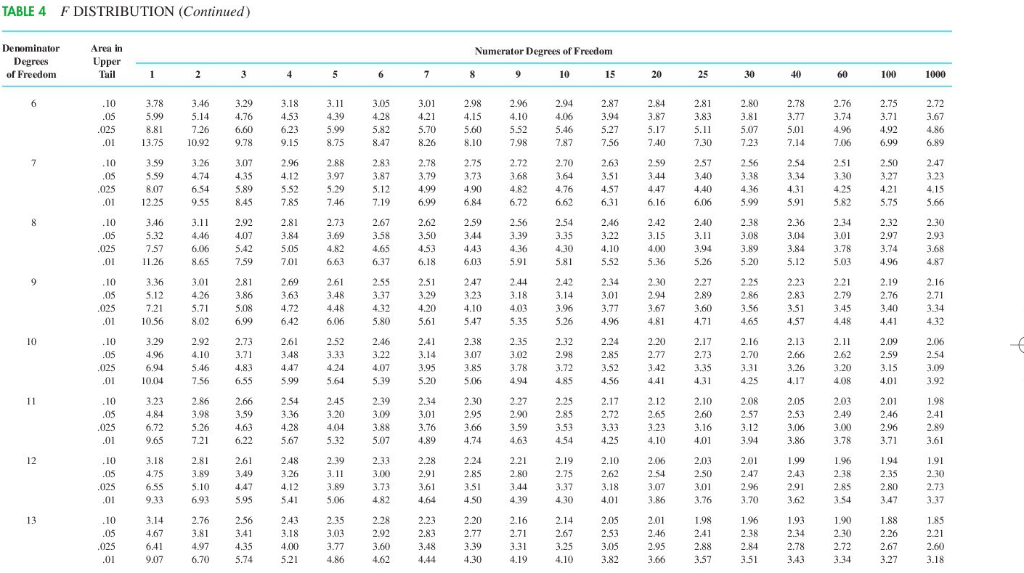
A 10-year study conducted by the American Heart Association provided data on how age, blood pressure,...
Fantastic news! We've Found the answer you've been seeking!
Question:
Transcribed Image Text:
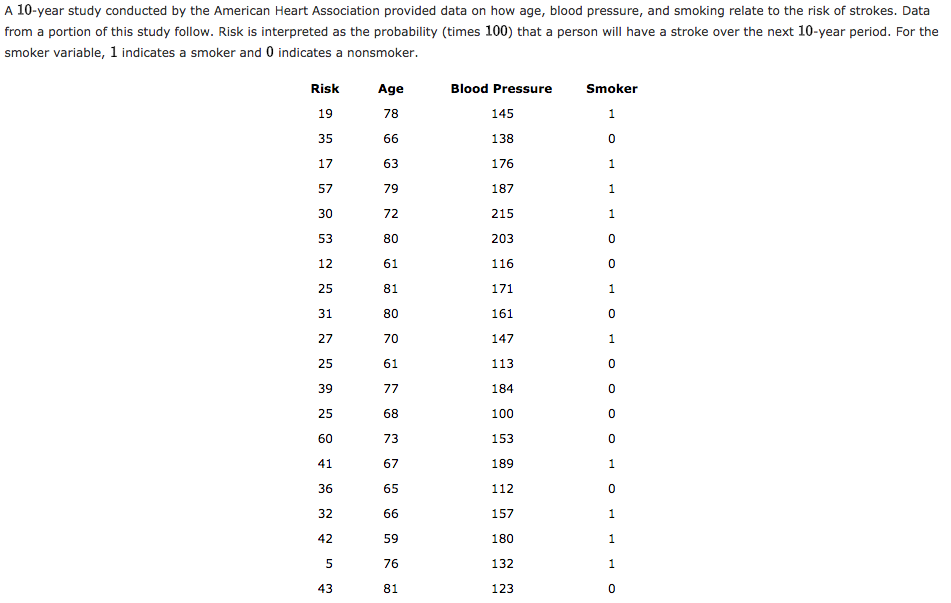
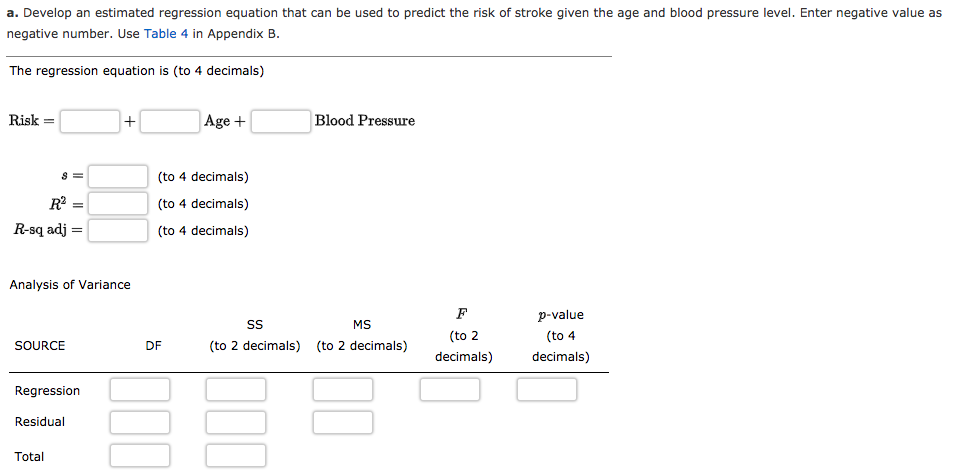
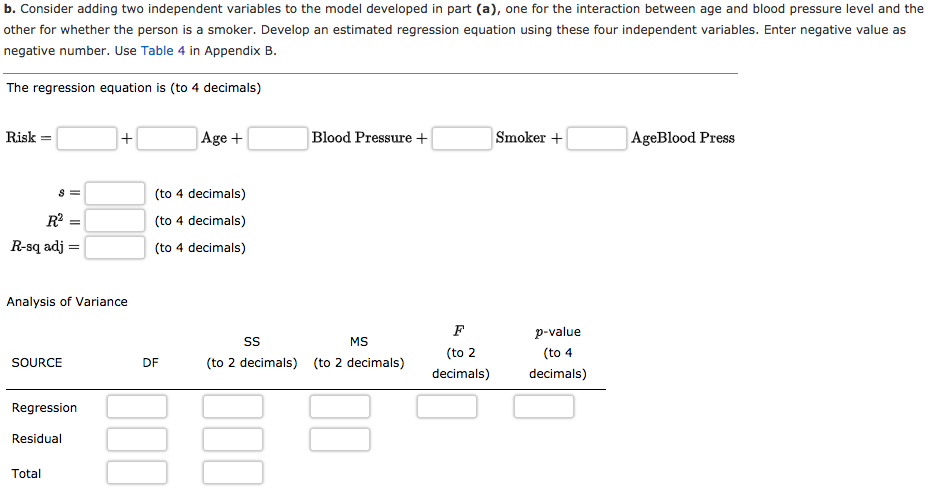
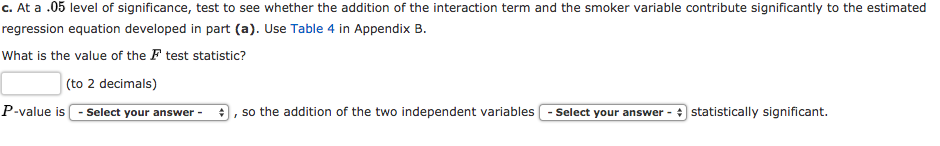
A 10-year study conducted by the American Heart Association provided data on how age, blood pressure, and smoking relate to the risk of strokes. Data from a portion of this study follow. Risk is interpreted as the probability (times 100) that a person will have a stroke over the next 10-year period. For the smoker variable, 1 indicates a smoker and 0 indicates a nonsmoker. Risk 19 35 17 57 30 53 12 25 31 27 25 39 25 60 41 35 32 42 36 5 43 Age 78 66 63 79 72 80 61 81 80 70 61 77 68 73 67 65 66 59 76 81 Blood Pressure 145 138 176 187 215 203 116 171 161 147 113 184 100 153 189 112 157 180 132 123 Smoker 1 0 1 1 1 0 0 1 0 1 0 0 0 0 HO 1 0 1 1 H 1 0 a. Develop an estimated regression equation that can be used to predict the risk of stroke given the age and blood pressure level. Enter negative value as negative number. Use Table 4 in Appendix B. The regression equation is (to 4 decimals) Risk = 8 = R² = R-sq adj = Analysis of Variance SOURCE Regression Residual Total + Age + (to 4 decimals) (to 4 decimals) (to 4 decimals) DF Blood Pressure SS MS (to 2 decimals) (to 2 decimals) F (to 2 decimals) p-value (to 4 decimals) b. Consider adding two independent variables to the model developed in part (a), one for the interaction between age and blood pressure level and the other for whether the person is a smoker. Develop an estimated regression equation using these four independent variables. Enter negative value as negative number. Use Table 4 in Appendix B. The regression equation is (to 4 decimals) Risk = 8 = R² = R-sq adj= = Analysis of Variance SOURCE Regression Residual Total + Age + (to 4 decimals) (to 4 decimals) (to 4 decimals) DF Blood Pressure + SS MS (to 2 decimals) (to 2 decimals) F (to 2 decimals) Smoker + p-value (to 4 decimals) AgeBlood Press c. At a .05 level of significance, test to see whether the addition of the interaction term and the smoker variable contribute significantly to the estimated regression equation developed in part (a). Use Table 4 in Appendix B. What is the value of the F test statistic? (to 2 decimals) P-value is - Select your answer - + so the addition of the two independent variables - Select your answer statistically significant. I Entries in the table give F values, where a is the area or probability in the upper tail of the F distribution. For example, with 4 numerator degrees of freedom, 8 denominator degrees of freedom, and a .05 area in the upper tail, F05 = 3.84. Denominator Degrees of Freedon 2 Area in oppe 1 2 39.86 161.45 647.79 4052.18 4999.34 199 50 799 48 4 230.16 233.99 236.77 921.83 937.11 948 20 5763.96 5858.95 1928.33 924 929 933 19.25 19.30 19.33 19.35 916 19.16 19.00 38.51 39.00 39.17 39.25 39.30 39.33 39.36 98.50 99,00 99.16 5.46 9.55 30.03 53 50 215.71 224.58 864.15 899 60 403.53 5624.26 5.39 5.34 9.28 9.12 9.01 2016 28.71 28.24 27.01 5.28 8.94 4.19 4.11 4.05 4.01 003 02 0:40 16.69 15.98 15.52 15.21 0.00 8.89 2767 3.98 DAUN 4.98 227 4.00 685 10.46 Numerator Degrees of Freedom 59.44 238.88 95664 5980.95 027 19.37 39.37 27.40 3.95 0.00 14.80 3.94 000 4.66 3.92 201 15 14.55 62.05 62.26 62 53 62.79 63.01 63.30 60.19 241.88 6122 61.74 245.95 248.02 249.26 250.10 251.14 252.20 253.04 254.19 963.28 968.63 984.87 993.08 998.09 1001.40 1005.60 1009.79 1013.16 1017.76 5022.40 6055.93 6156.97 6208.66 6239.86 6260.35 6286.43 631297 6333.92 6362.80 20 3.324 15 643 9.72 19.45 3.84 20% 086 4,20 14.02 25 30 850 13.91 40 19.46 39.46 39A7 26.50 3.82 Ov 13.84 26.41 3.80 244 13.75 29 047 19.48 39.48 5.15 8.31 26.32 3.79 0000 13.65 19.49 39,49 20 19.49 39.50 99.50 5.13 8.33 xu 3.76 206 12 47 TABLE 4 F DISTRIBUTION (Continued) Denominator Degree of Freedom + Numerator Degrees of Freedom 5 6 7 8 9 3.46 3.29 3.18 3.11 3.05 3.01 15 20 25 8 9 8 तलेलेल Fadg 1228 A 10-year study conducted by the American Heart Association provided data on how age, blood pressure, and smoking relate to the risk of strokes. Data from a portion of this study follow. Risk is interpreted as the probability (times 100) that a person will have a stroke over the next 10-year period. For the smoker variable, 1 indicates a smoker and 0 indicates a nonsmoker. Risk 19 35 17 57 30 53 12 25 31 27 25 39 25 60 41 35 32 42 36 5 43 Age 78 66 63 79 72 80 61 81 80 70 61 77 68 73 67 65 66 59 76 81 Blood Pressure 145 138 176 187 215 203 116 171 161 147 113 184 100 153 189 112 157 180 132 123 Smoker 1 0 1 1 1 0 0 1 0 1 0 0 0 0 HO 1 0 1 1 H 1 0 a. Develop an estimated regression equation that can be used to predict the risk of stroke given the age and blood pressure level. Enter negative value as negative number. Use Table 4 in Appendix B. The regression equation is (to 4 decimals) Risk = 8 = R² = R-sq adj = Analysis of Variance SOURCE Regression Residual Total + Age + (to 4 decimals) (to 4 decimals) (to 4 decimals) DF Blood Pressure SS MS (to 2 decimals) (to 2 decimals) F (to 2 decimals) p-value (to 4 decimals) b. Consider adding two independent variables to the model developed in part (a), one for the interaction between age and blood pressure level and the other for whether the person is a smoker. Develop an estimated regression equation using these four independent variables. Enter negative value as negative number. Use Table 4 in Appendix B. The regression equation is (to 4 decimals) Risk = 8 = R² = R-sq adj= = Analysis of Variance SOURCE Regression Residual Total + Age + (to 4 decimals) (to 4 decimals) (to 4 decimals) DF Blood Pressure + SS MS (to 2 decimals) (to 2 decimals) F (to 2 decimals) Smoker + p-value (to 4 decimals) AgeBlood Press c. At a .05 level of significance, test to see whether the addition of the interaction term and the smoker variable contribute significantly to the estimated regression equation developed in part (a). Use Table 4 in Appendix B. What is the value of the F test statistic? (to 2 decimals) P-value is - Select your answer - + so the addition of the two independent variables - Select your answer statistically significant. I Entries in the table give F values, where a is the area or probability in the upper tail of the F distribution. For example, with 4 numerator degrees of freedom, 8 denominator degrees of freedom, and a .05 area in the upper tail, F05 = 3.84. Denominator Degrees of Freedon 2 Area in oppe 1 2 39.86 161.45 647.79 4052.18 4999.34 199 50 799 48 4 230.16 233.99 236.77 921.83 937.11 948 20 5763.96 5858.95 1928.33 924 929 933 19.25 19.30 19.33 19.35 916 19.16 19.00 38.51 39.00 39.17 39.25 39.30 39.33 39.36 98.50 99,00 99.16 5.46 9.55 30.03 53 50 215.71 224.58 864.15 899 60 403.53 5624.26 5.39 5.34 9.28 9.12 9.01 2016 28.71 28.24 27.01 5.28 8.94 4.19 4.11 4.05 4.01 003 02 0:40 16.69 15.98 15.52 15.21 0.00 8.89 2767 3.98 DAUN 4.98 227 4.00 685 10.46 Numerator Degrees of Freedom 59.44 238.88 95664 5980.95 027 19.37 39.37 27.40 3.95 0.00 14.80 3.94 000 4.66 3.92 201 15 14.55 62.05 62.26 62 53 62.79 63.01 63.30 60.19 241.88 6122 61.74 245.95 248.02 249.26 250.10 251.14 252.20 253.04 254.19 963.28 968.63 984.87 993.08 998.09 1001.40 1005.60 1009.79 1013.16 1017.76 5022.40 6055.93 6156.97 6208.66 6239.86 6260.35 6286.43 631297 6333.92 6362.80 20 3.324 15 643 9.72 19.45 3.84 20% 086 4,20 14.02 25 30 850 13.91 40 19.46 39.46 39A7 26.50 3.82 Ov 13.84 26.41 3.80 244 13.75 29 047 19.48 39.48 5.15 8.31 26.32 3.79 0000 13.65 19.49 39,49 20 19.49 39.50 99.50 5.13 8.33 xu 3.76 206 12 47 TABLE 4 F DISTRIBUTION (Continued) Denominator Degree of Freedom + Numerator Degrees of Freedom 5 6 7 8 9 3.46 3.29 3.18 3.11 3.05 3.01 15 20 25 8 9 8 तलेलेल Fadg 1228
Expert Answer:

Related Book For 
Essentials Of Statistics For Business And Economics
ISBN: 9781305081598
7th Edition
Authors: David Anderson, Thomas Williams, Dennis Sweeney, Jeffrey Cam
Posted Date:
Students also viewed these mathematics questions
-
A 10-year study conducted by the American Heart Association provided data on how age, systolic blood pressure, and smoking relate to the risk of strokes. Assume that the following data are from a...
-
Use Table 4 in Appendix I to approximate the p-value for the t statistic in each situation: a. A two-tailed test with t = 2.43 and 12 df b. A right-tailed test with t = 3.21 and 16 df c. A two-tailed...
-
Use Table 4 in Appendix I to find the following critical values: a. An upper one-tailed rejection region with = .05 and 11 df. b. A two-tailed rejection region with = .05 and 7 df. c. A lower...
-
Corning-Howell reported taxable income in 2013 of $120 million. At December 31, 2013, the reported amount of some assets and liabilities in the financial statements differed from their tax bases as...
-
What are the five components of a standard design pattern definition?
-
What is a post-audit? What are the potential benefits of a postaudit?
-
Which method of estimating uncollectible receivables focuses on net credit sales? a. Aging approach b. Percent-of-sales approach C. Net realizable value approach d. All of the above
-
The following represents selected information taken from a companys aging schedule to estimate uncollectible accounts receivable at year end. Instructions (a) Calculate the total estimated bad debts...
-
HOW fast is the world economy growing? How important is China as an engine of growth? How much richer is the average person in America than in China? The answers to these huge questions depend...
-
On March 1, 2008, Ginny Tyler established Seltzer Realty. Ginny completed the following transactions during the month of March: a. Opened a business bank account with a deposit of $30,000 from...
-
Suppose a computer has 2^20 words of main memory, and a cache of 128 blocks, where each cache block contains 64 words. How many blocks of main memory are there?
-
1. (8 pts) Maria is a college student that can earn $10 per hour working at Jimmy Johns. Maria has 80 hours of free time each month that she can split between working and leisure. The graph below...
-
ABC Ltd shares are assumed to be trading at their fair value of $63.09. The dividend per share next year is $2.35 and grows at a constant rate each year. The appropriate discount rate is 12% p.a.....
-
According to economists, the process of optimal decision making by consumers typically yields total benefits well above the amount paid for the goods. These market-created benefits are referred to as...
-
Problem Description : Palindromes are words or numbers that are read the same forwards and backwards. For example: 1, 2, 3, 4, 5, 6, 7, 8, 9, 11, 22, 33, 44, 55, 66, 77, 88, 99, 101, 111, 121 are...
-
Suppose Marriott evaluates a project that requires participation of all three divisions. What is the appropriate hurdle rate? This is based off of this case study: Marriott Corporation: The Cost of...
-
Suppose that Ivanhoe uses a periodic inventory system and has these account balances: Purchases $571,000; Purchase Returns and Allowances $11,800; Purchases Discounts $9,100; and Freight-In $14,300....
-
Suppose the spot and six-month forward rates on the Norwegian krone are Kr 5.78 and Kr 5.86, respectively. The annual risk-free rate in the United States is 3.8 percent, and the annual risk-free rate...
-
The College Board SAT college entrance exam consists of three parts: math, writing, and critical reading (The Wall Almanac, 2012). Sample data showing the math and writing scores for a sample of 12...
-
Refer to exercise 7, where an estimated regression equation relating years of experience and annual sales was developed. a. Compute the residuals and construct a residual plot for this problem. b. Do...
-
A sample containing years to maturity and yield for 40 corporate bonds is contained in the data file named CorporateBonds (Barrons, April 2, 2012). a. What is the sample mean years to maturity for...
-
How does an auditor make a preliminary judgment about materiality during the planning phase?
-
In the Hochfelder case all of the following were factors in the case except a. The Securities Exchange Act of 1934. Data From Exchange Act 1934 When the Securities Act was passed, the Interstate...
-
Refer to the example of an auditors report issued in 1915. List the differences between the report styles in 1915 and today (refer to Chapter 1). Indicate in what ways this report would be deficient...

Study smarter with the SolutionInn App