Question: a. 14196 b. 9634 c. 2315 d. 3671 e. 8642 A company distributes an item known as a tie bar. The demand and cost information

a. 14196
b. 9634
c. 2315
d. 3671
e. 8642 a. 14196 b. 9634 c. 2315 d. 3671 e. 8642 A
A company distributes an item known as a tie bar. The demand and cost information are as below: Awng Month Demand DI 11107 units Sd of monthly demand 4200 units lead time LT fored 0.5 month Bem value in SIM 0 25 Order cost order in SIS 10 Carrying costin per month w 2% In stock probability during LT B5% What is the re-order point (ROPI? (Hint: ROP - average demand during lead time + safety stock level) (Hint: safety stock = standard deviation of demand * service probability z value square root of lead time length) STANDARD STATISTICAL TABLES Areas under the Normal Distribution the table gives the clatire probability to the standardised manual alet Lor) 111.21 P1) 1 0.02 0.00 0.04 0.05 0.05 0.07 0.00 0.09 0.0 0.5000 0.5040 6.5045 0.5120 0.5253 0.51 0.52 0.8 0.5319 0.5359 0.1 0.57 0.9434 0.57 0.587 0.587 0.55 0.56 0.57 0.5714 0.5753 0.2 0.579) 0.5692 0.5671 0.5810 0.54 0.897 0.60 0.64 0.40 0.610 0.3 0.67 0.0 0.4255 0.00 0.00 0.66 0.6406 0.41 0.6480 0.6517 0.4 0.655 0.6 0.6921 0.6 0.6700 0.6736 0.677 4.60 0.6044 0.679 0.5 0.5 0.6 0.69 0.7010.2054 O. TO 0.7123 4.7257 0.7280 0.1234 0.6 0.7257 0.721 0.7180.7357 0.7389 0.1022 0.7654 0.1446 0.7517 0.7549 0.1 0.750 0.7411 0.10 0.7673 0.770 0.7734 0.74 0.7 0.22 0.7854 0.0 0.78 0.7 0.75 0.797 0.79 0.10 0.6051 0.10 0.10 0.1333 0.9 0.6151 0.01 0.0012 0.003 0.6244 0.628 0.005 0.0140 0.68 0.2389 1.6 0.04 0.108 0.64 0.64 0.158 0.6531 0.1554 0.1577 0,05 0.1021 1. 0.0 0.0 0.14 0.17 0.02 0.17 0.1770 0.6790 0.00 0.00 1.2 0.13 0.00 0.00 0.00 0.00 0.00 0.00 0.00 0.00 0.1995 1.3 0.1032 0.04 0.10 0.412 0.20 0.VIIS 0.91.11 0.1147 0.19 0.1177 4.0202 0.13 0.21 0.12 0.125 0.025 0.0279 0.22 0.23 0.119 1.5 0.3 0.436 0.19 0.000 0.000 0.19 0.1% 0.1 0.1 0.1 1.6 0.9 0.14 0.0074 0.1 0.1 0.1 0. 0.125 0.15 0.1 1.7 0. 0.7 0.1 0.4542 0.11 0.2 0.4 0.14 0.1 0.1 1.1 0.1 0.XAS ON 0.6 0.7 0.7 0.6 0.9 0.1 0.IN 1.1 0.2 0.ms 0.0 0.7 0.78 0.17 0.17 0.17 0.17 0.17 2.0 0.0 0.0 0.0 0.7 4.7 0.17 0.0 0.0 0.IT 2.1 0.2 0. 0.500 0.0.03 0.00 0.00 0.00 0.54 0.1957 2.2 0.0.0 6.14 0.0 0.0 0.0 0.0 0.10 2.3 0.9 0.19 e. ml. 0.71 0.19 0.11 0.1 0.16 2.3 0.132.100 0. 0.10.0.19 0.1 0..1952 2.4 0.9153.5 0.9 0.7 0..1 0.0.0.3.1 2.1 0.1 0.0 0.0 0.0 0.19 0.17 0.17 0.17 2.10.0.0.0.1 0..1 0.1 0.1 0..19 2.3.0.162.0 0.0 0.0 0.110.4.11 1 3.00 17 1.30 3.4 1.60 . 2. 16.1.0.0.11 0.0.0.0.1.1.2000

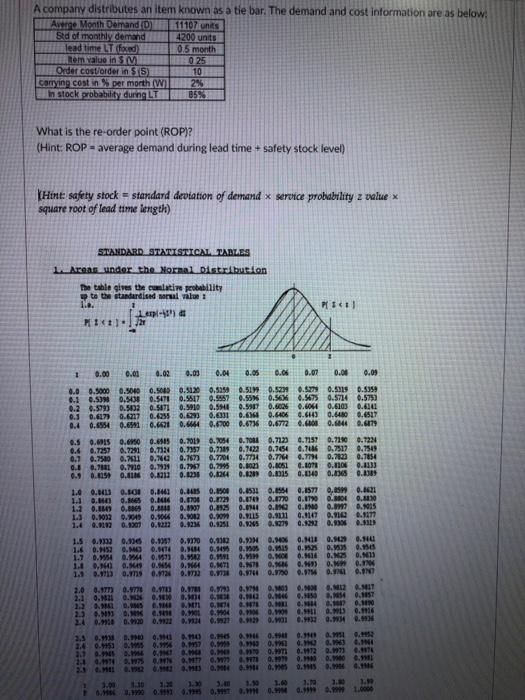
Step by Step Solution

There are 3 Steps involved in it

1 Expert Approved Answer
Step: 1 Unlock blur-text-image
Question Has Been Solved by an Expert!

Get step-by-step solutions from verified subject matter experts

Step: 2 Unlock
Step: 3 Unlock

Students Have Also Explored These Related General Management Questions!