

Question: A. (2 points) Define the dependency ratio, d, as the ratio of those that are not employed (PN) to those that are employed (N) so
A. (2 points) Define the dependency ratio, d, as the ratio of those that are not employed (PN) to those that are employed (N) so that d=(PN)/N. Using the data above, compute the dependency ratio and the level of TFP, A in 1988 and 2003.
B. (2 points) Write the growth rate of output per capita, Y/P in terms of the growth rate of output per worker Y/N. [Hint: Define the population to employment ratio as d^=1+d.]
C. (2 points) Between 1988 and 2003, Vietnam enforced a two-child policy such that households could only have, at most, two children. How would such a policy impact output per worker Y/N in the short-run (during the policy) and in the medium-run (20 years after the policy)? Explain.
D. (2 points) Consider the source of growth in output per capita, Y/P, between 1988 and 2003. Use the growth accounting methodology to allocate growth in output per capita (Y/P) to TFP growth, accumulation of capital per worker (K/N), and grwoth in d^. Which factor is most important in accounting for growth in output per capita between 1988 and 2003?
Consider the following data for Australia in 2003
Table 2: Data for Australia
| Year | Y | K | P | N |
| 2003 | 825,000 | 3,475,000 | 20 | 9 |
E. (2 points) What is the contribution of TFP differences in explaining differences in output per worker, Y/N between Vietnam and Australia in 2003?
View keyboard shortcuts
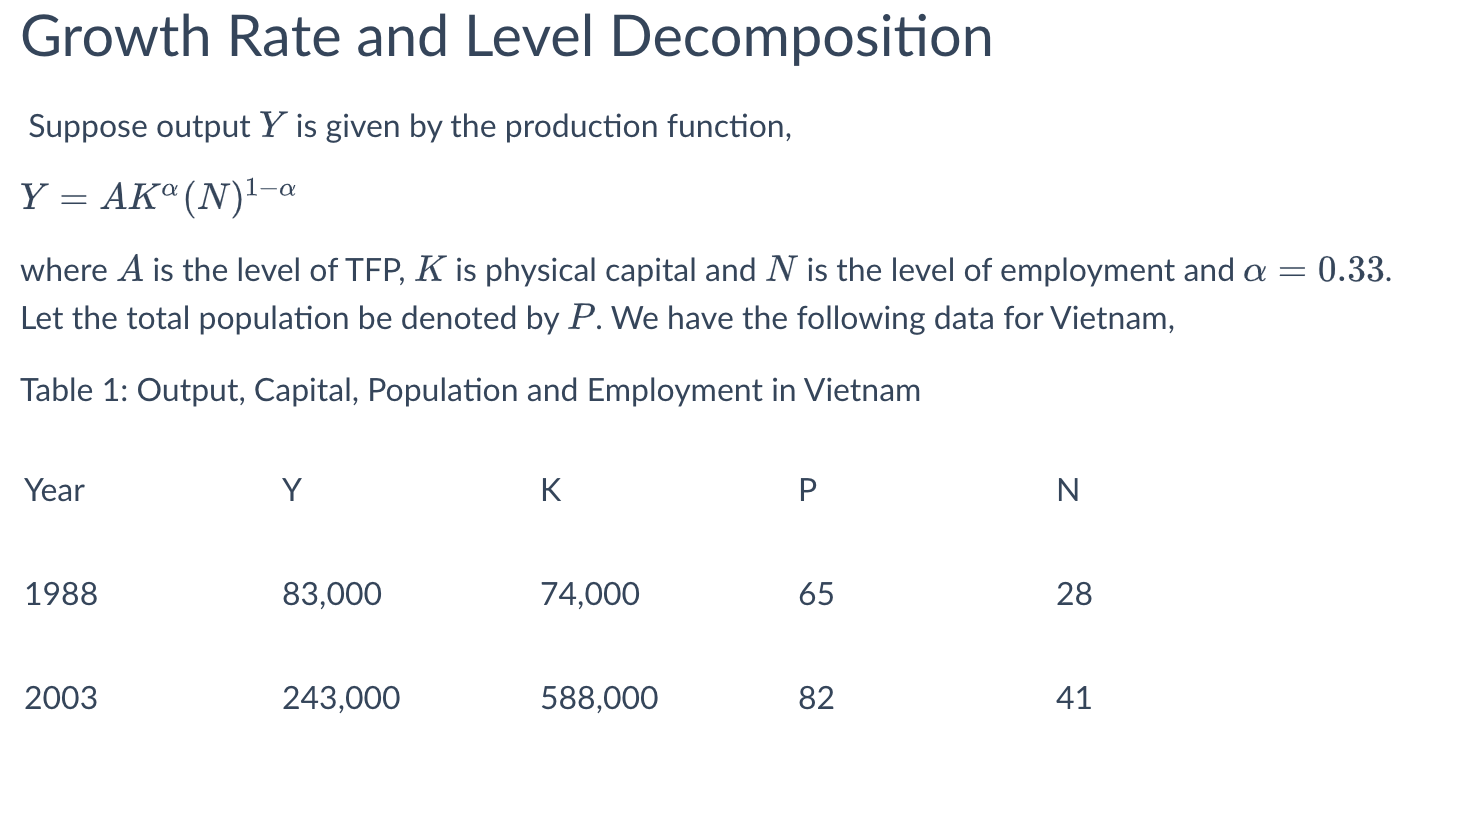
Growth Rate and Level Decomposition Suppose output Y is given by the production function, Y=AK(N)1 where A is the level of TFP, K is physical capital and N is the level of employment and =0.33. Let the total population be denoted by P. We have the following data for Vietnam, Table 1: Output, Capital, Population and Employment in Vietnam Growth Rate and Level Decomposition Suppose output Y is given by the production function, Y=AK(N)1 where A is the level of TFP, K is physical capital and N is the level of employment and =0.33. Let the total population be denoted by P. We have the following data for Vietnam, Table 1: Output, Capital, Population and Employment in Vietnam
Step by Step Solution
There are 3 Steps involved in it

Get step-by-step solutions from verified subject matter experts