

Question: A: -30% B: -15% C: 0% D: 15% E: 30% The figure in the popup window. shows the one-year return distribution for RCS stock Calculate
A: -30% 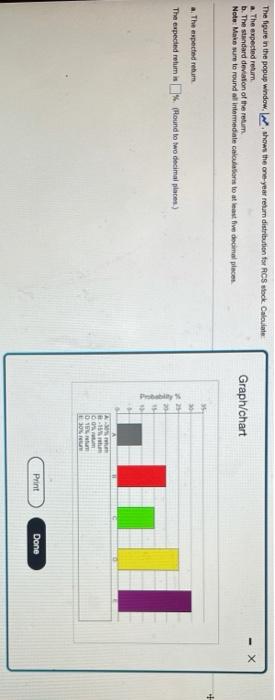
B: -15%
C: 0%
D: 15%
E: 30%
The figure in the popup window. shows the one-year return distribution for RCS stock Calculate a. The expected return b. The standard deviation of the retum NoteMake sure to round at interdiale calculation to at least five decimal places - X Graph/chart 30 The expected retum The expected retums % Hound to wo decimal places) 2 AN . CO D Print Done
Step by Step Solution
There are 3 Steps involved in it
1 Expert Approved Answer
Step: 1 Unlock

Question Has Been Solved by an Expert!
Get step-by-step solutions from verified subject matter experts
Step: 2 Unlock
Step: 3 Unlock