Question: A | '5 | '9 | D | t | i | The first table presents multiples for 5 peers of Firm I and the
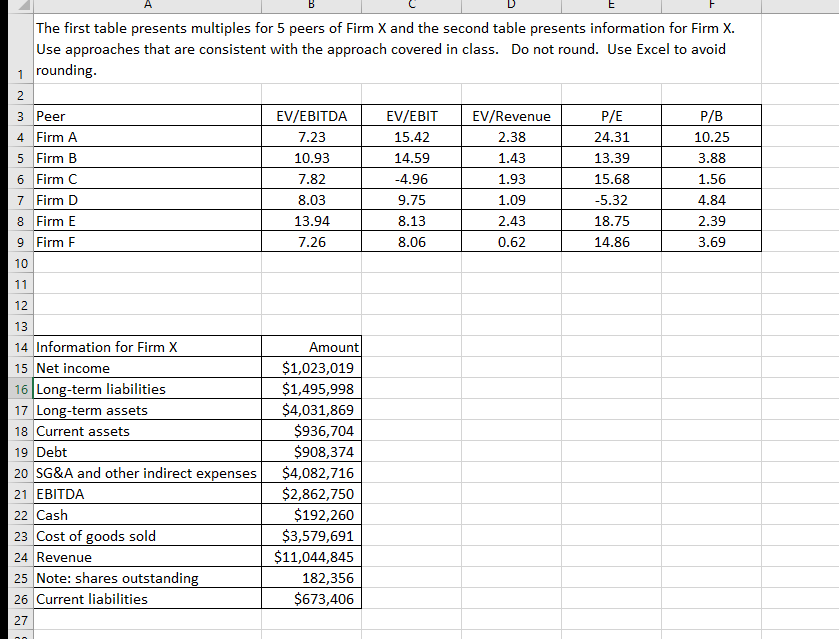
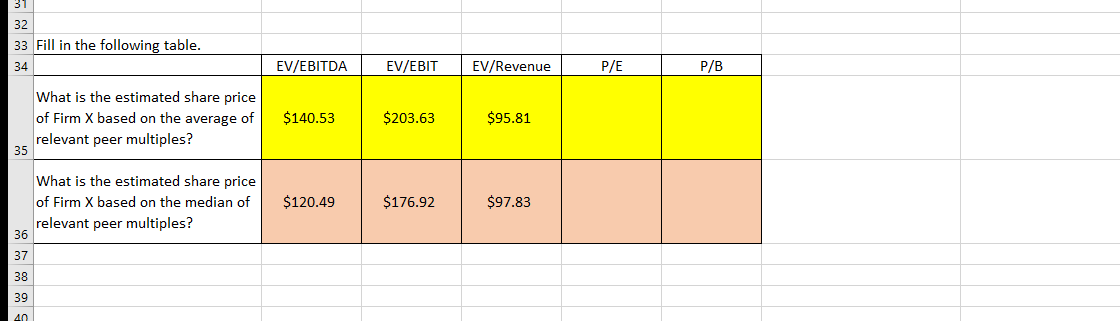
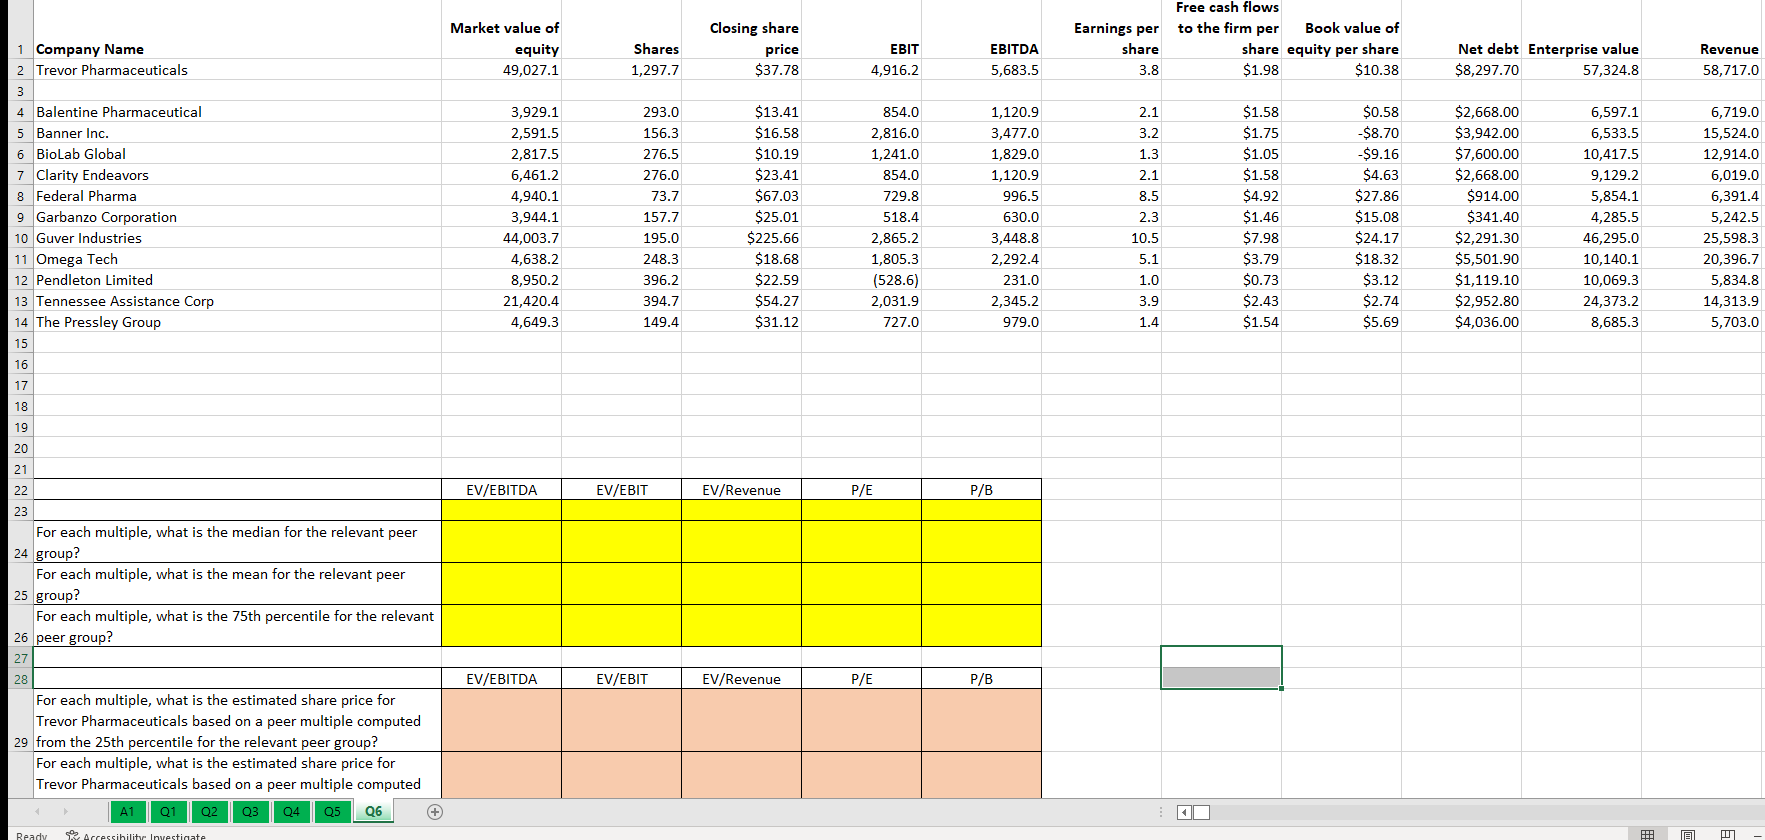
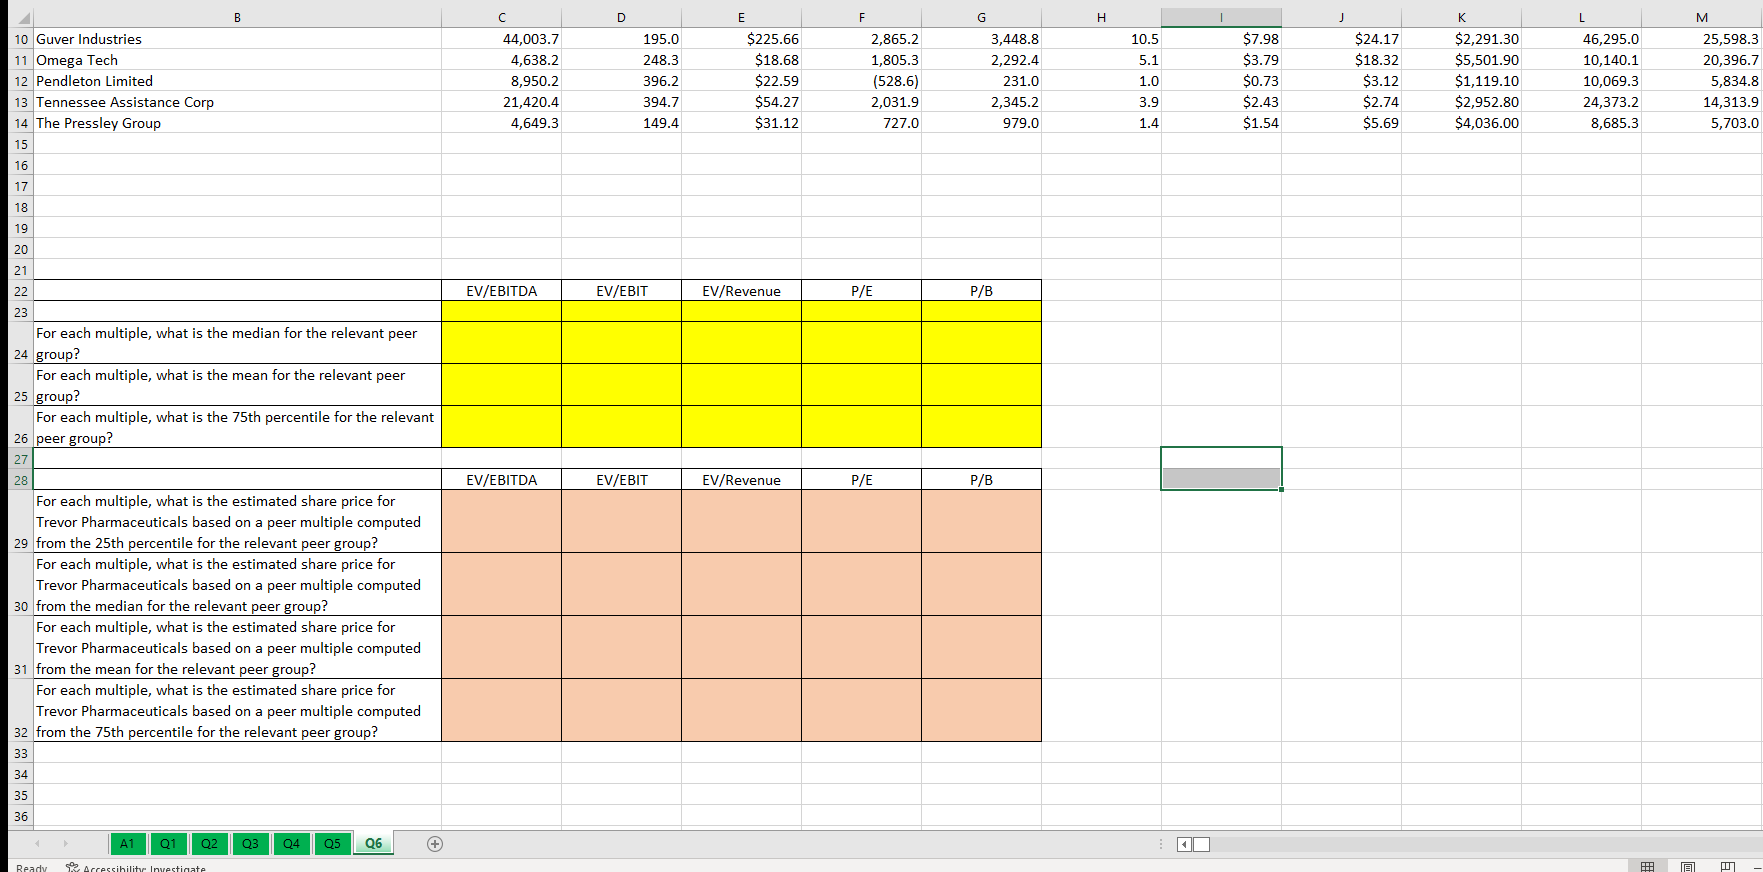
A | '5 | '9 | D | t | i | The first table presents multiples for 5 peers of Firm I and the second table presents information for Firm it. Use approaches that are consistent with the approach covered in class. Do not round. Use Excel to avoid rounding. Peer $1,929,019 m Longterm liabilities $1,495,993 $192,260 53,5?9,591 511,044,945 132,356 Fill in the following table. EV! E BITDA EV] E BIT EW'Reven ue P! B What is the estimated share price of Firm X based on the average of 5140.53 relevant peer multiples? What is the estimated share price of Firm X based on the median of relevant peer multiples? 5203.63 $95.81 Free cash flows Market value of Closing share Earnings per to the firm per Book value of Company Name equity Shares price EBIT EBITDA share share equity per share Net debt Enterprise value Revenue Trevor Pharmaceuticals 49,027.1 1,297.7 $37.78 4,916.2 5,683.5 3.8 $1.98 $10.38 $8,297.70 57,324.8 58,717.0 W 4 Balentine Pharmaceutical 3,929.1 293.0 $13.41 854.0 1,120.9 2.1 $1.58 $0.58 $2,668.00 6,597.1 6,719.0 5 Banner Inc. 2,591.5 156.3 $16.58 2,816.0 3,477.0 3.2 $1.75 -$8.70 $3,942.00 6,533.5 15,524.0 6 BioLab Global 2,817.5 276.5 $10.19 1,241.0 1,829.0 1.3 $1.05 -$9.16 $7,600.00 10,417.5 12,914.0 7 Clarity Endeavors 6,461.2 276.0 $23.41 854.0 1,120.9 2.1 $1.58 $4.63 $2,668.00 9,129.2 6,019.0 8 Federal Pharma 4,940.1 73.7 $67.03 729.8 996.5 8.5 $4.92 $27.86 $914.00 5,854.1 6,391.4 9 Garbanzo Corporation 3,944.1 157.7 $25.01 518.4 630.0 2.3 $1.46 $15.08 $341.40 4,285.5 5,242.5 10 Guver Industries 44,003.7 195.0 $225.66 2,865.2 3,448.8 10.5 $7.98 $24.17 $2,291.30 46,295.0 25,598.3 11 Omega Tech 4,638.2 248.3 $18.68 1,805.3 2,292.4 5.1 $3.79 $18.32 $5,501.90 10,140.1 20,396.7 12 Pendleton Limited 8,950.2 396.2 $22.59 (528.6) 231.0 1.0 $0.73 $3.12 $1,119.10 10,069.3 5,834.8 13 Tennessee Assistance Corp 21,420.4 394.7 $54.27 2,031.9 2,345.2 3.9 $2.43 $2.74 $2,952.80 24,373.2 14,313.9 14 The Pressley Group 4,649.3 149.4 $31.12 727.0 979.0 1.4 $1.54 $5.69 $4,036.00 8,685.3 5,703.0 15 16 17 18 19 20 21 22 EV/EBITDA EV/EBIT EV/Revenue P/E P/B 23 For each multiple, what is the median for the relevant peer 24 group: For each multiple, what is the mean for the relevant peer 25 group? For each multiple, what is the 75th percentile for the relevant 26 peer group? 27 28 EV/EBITDA EV/EBIT EV/Revenue P/E P/B For each multiple, what is the estimated share price for Trevor Pharmaceuticals based on a peer multiple computed 29 from the 25th percentile for the relevant peer group? For each multiple, what is the estimated share price for Trevor Pharmaceuticals based on a peer multiple computed A1 Q1 Q2 Q3 Q4 Q5 Q6 +B C D E F G H K M 10 Guver Industries 44,003.7 195.0 $225.66 2,865.2 3,448.8 10.5 $7.98 $24.17 $2,291.30 46,295.0 25,598.3 11 Omega Tech 4,638.2 248.3 $18.68 1,805.3 2,292.4 5.1 $3.79 $18.32 $5,501.90 10,140.1 20,396.7 12 Pendleton Limited 8,950.2 396.2 $22.59 (528.6) 231.0 1.0 $0.73 $3.12 $1,119.10 10,069.3 5,834.8 13 Tennessee Assistance Corp 21,420.4 394.7 $54.27 2,031.9 2,345.2 3.9 $2.43 $2.74 $2,952.80 24,373.2 14,313.9 14 The Pressley Group 4,649.3 149.4 $31.12 727.0 979.0 1.4 $1.54 $5.69 $4,036.00 8,685.3 5,703.0 15 16 17 18 19 20 21 22 EV/EBITDA EV/EBIT EV/Revenue P/E P/B 23 For each multiple, what is the median for the relevant peer 24 group For each multiple, what is the mean for the relevant peer 25 group? For each multiple, what is the 75th percentile for the relevant 26 peer group: 27 28 EV/EBITDA EV/EBIT EV/Revenue P/E P/B For each multiple, what is the estimated share price for Trevor Pharmaceuticals based on a peer multiple computed 29 from the 25th percentile for the relevant peer group? For each multiple, what is the estimated share price for Trevor Pharmaceuticals based on a peer multiple computed 30 from the median for the relevant peer group? For each multiple, what is the estimated share price for Trevor Pharmaceuticals based on a peer multiple computed 31 from the mean for the relevant peer group? For each multiple, what is the estimated share price for Trevor Pharmaceuticals based on a peer multiple computed 32 from the 75th percentile for the relevant peer group? 33 34 35 36 A1 Q1 Q2 Q3 Q4 Q5 06 +
Step by Step Solution
There are 3 Steps involved in it
1 Expert Approved Answer
Step: 1 Unlock
Question Has Been Solved by an Expert!
Get step-by-step solutions from verified subject matter experts
Step: 2 Unlock
Step: 3 Unlock
Students Have Also Explored These Related Finance Questions!