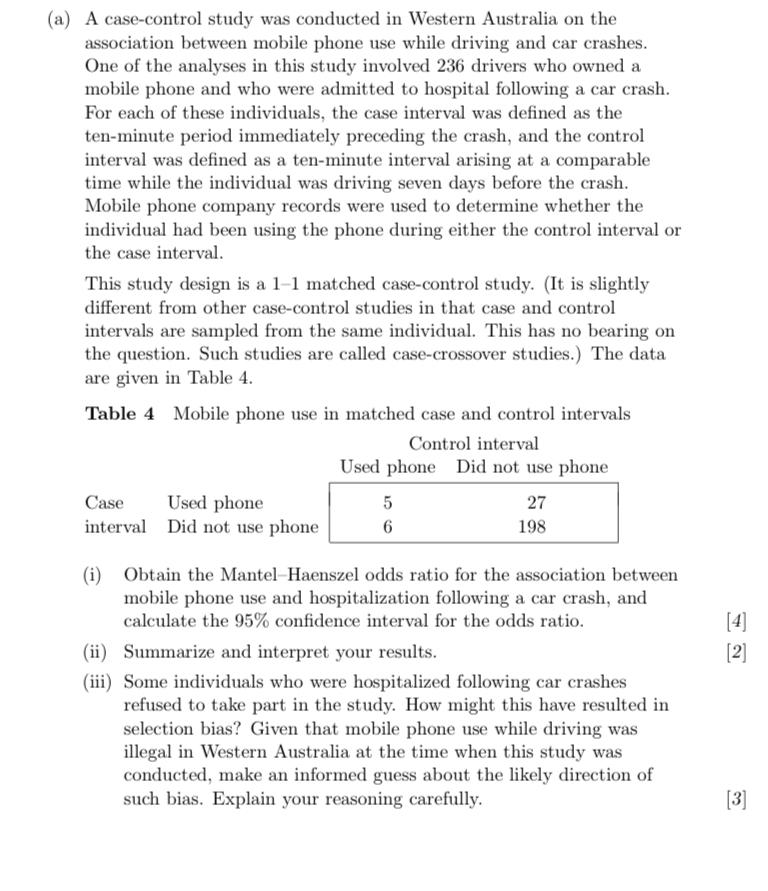
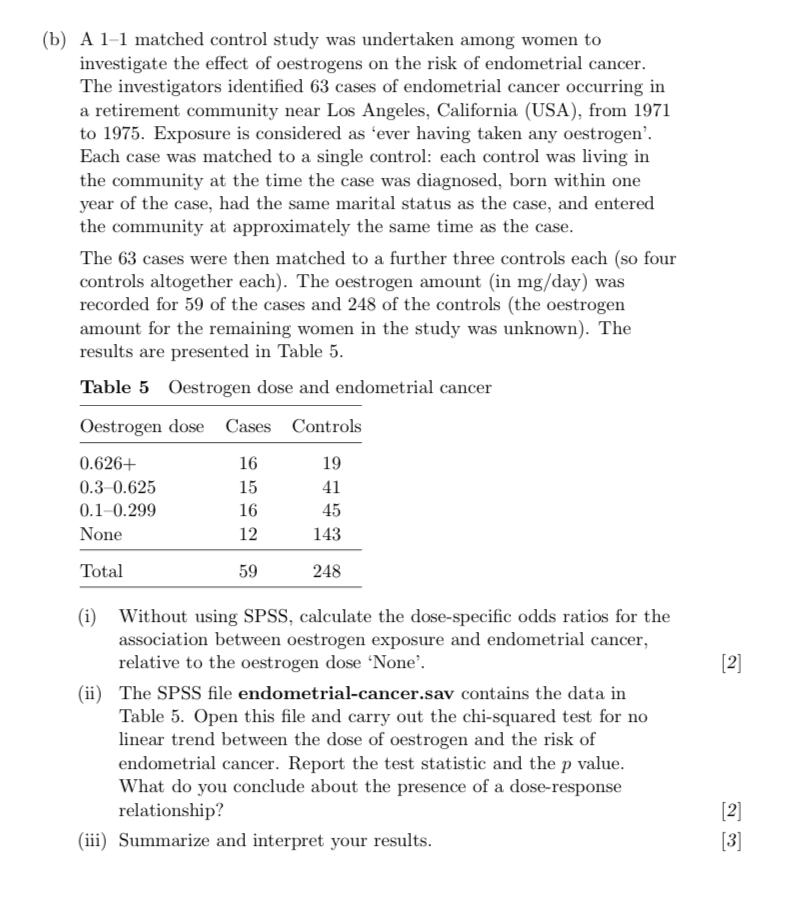
Question: (a) A case-control study was conducted in Western Australia on the association between mobile phone use while driving and car crashes. One of the analyses

(a) A case-control study was conducted in Western(a) A case-control study was conducted in Western

(a) A case-control study was conducted in Western Australia on the association between mobile phone use while driving and car crashes. One of the analyses in this study involved 236 drivers who owned a mobile phone and who were admitted to hospital following a car crash. For each of these individuals, the case interval was defined as the ten-minute period immediately preceding the crash, and the control interval was defined as a ten-minute interval arising at a comparable time while the individual was driving seven days before the crash. Mobile phone company records were used to determine whether the individual had been using the phone during either the control interval or the case interval. This study design is a 1-1 matched case-control study. (It is slightly different from other case-control studies in that case and control intervals are sampled from the same individual. This has no bearing on the question. Such studies are called case-crossover studies.) The data are given in Table 4. Table 4 Mobile phone use in matched case and control intervals Control interval Used phone Did not use phone Case Used phone 5 interval Did not use phone 6 198 27 [2] (i) Obtain the Mantel Haenszel odds ratio for the association between mobile phone use and hospitalization following a car crash, and calculate the 95% confidence interval for the odds ratio. (ii) Summarize and interpret your results. (iii) Some individuals who were hospitalized following car crashes refused to take part in the study. How might this have resulted in selection bias? Given that mobile phone use while driving was illegal in Western Australia at the time when this study was conducted, make an informed guess about the likely direction of such bias. Explain your reasoning carefully. [3] (b) A 1-1 matched control study was undertaken among women to investigate the effect of oestrogens on the risk of endometrial cancer. The investigators identified 63 cases of endometrial cancer occurring in a retirement community near Los Angeles, California (USA), from 1971 to 1975. Exposure is considered as 'ever having taken any oestrogen'. Each case was matched to a single control: each control was living in the community at the time the case was diagnosed, born within one year of the case, had the same marital status as the case, and entered the community at approximately the same time as the case. The 63 cases were then matched to a further three controls each (so four controls altogether each). The oestrogen amount (in mg/day) was recorded for 59 of the cases and 248 of the controls (the oestrogen amount for the remaining women in the study was unknown). The results are presented in Table 5. Table 5 Oestrogen dose and endometrial cancer Oestrogen dose Cases Controls 19 0.626+ 0.3-0.625 0.1-0.299 None 16 15 16 12 41 45 143 Total 59 248 [2] (i) Without using SPSS, calculate the dose-specific odds ratios for the association between oestrogen exposure and endometrial cancer, relative to the oestrogen dose "None. (ii) The SPSS file endometrial-cancer.sav contains the data in Table 5. Open this file and carry out the chi-squared test for no linear trend between the dose of oestrogen and the risk of endometrial cancer. Report the test statistic and the p value. What do you conclude about the presence of a dose-response relationship? (iii) Summarize and interpret your results. [2] [3] (a) A case-control study was conducted in Western Australia on the association between mobile phone use while driving and car crashes. One of the analyses in this study involved 236 drivers who owned a mobile phone and who were admitted to hospital following a car crash. For each of these individuals, the case interval was defined as the ten-minute period immediately preceding the crash, and the control interval was defined as a ten-minute interval arising at a comparable time while the individual was driving seven days before the crash. Mobile phone company records were used to determine whether the individual had been using the phone during either the control interval or the case interval. This study design is a 1-1 matched case-control study. (It is slightly different from other case-control studies in that case and control intervals are sampled from the same individual. This has no bearing on the question. Such studies are called case-crossover studies.) The data are given in Table 4. Table 4 Mobile phone use in matched case and control intervals Control interval Used phone Did not use phone Case Used phone 5 interval Did not use phone 6 198 27 [2] (i) Obtain the Mantel Haenszel odds ratio for the association between mobile phone use and hospitalization following a car crash, and calculate the 95% confidence interval for the odds ratio. (ii) Summarize and interpret your results. (iii) Some individuals who were hospitalized following car crashes refused to take part in the study. How might this have resulted in selection bias? Given that mobile phone use while driving was illegal in Western Australia at the time when this study was conducted, make an informed guess about the likely direction of such bias. Explain your reasoning carefully. [3] (b) A 1-1 matched control study was undertaken among women to investigate the effect of oestrogens on the risk of endometrial cancer. The investigators identified 63 cases of endometrial cancer occurring in a retirement community near Los Angeles, California (USA), from 1971 to 1975. Exposure is considered as 'ever having taken any oestrogen'. Each case was matched to a single control: each control was living in the community at the time the case was diagnosed, born within one year of the case, had the same marital status as the case, and entered the community at approximately the same time as the case. The 63 cases were then matched to a further three controls each (so four controls altogether each). The oestrogen amount (in mg/day) was recorded for 59 of the cases and 248 of the controls (the oestrogen amount for the remaining women in the study was unknown). The results are presented in Table 5. Table 5 Oestrogen dose and endometrial cancer Oestrogen dose Cases Controls 19 0.626+ 0.3-0.625 0.1-0.299 None 16 15 16 12 41 45 143 Total 59 248 [2] (i) Without using SPSS, calculate the dose-specific odds ratios for the association between oestrogen exposure and endometrial cancer, relative to the oestrogen dose "None. (ii) The SPSS file endometrial-cancer.sav contains the data in Table 5. Open this file and carry out the chi-squared test for no linear trend between the dose of oestrogen and the risk of endometrial cancer. Report the test statistic and the p value. What do you conclude about the presence of a dose-response relationship? (iii) Summarize and interpret your results. [2] [3]

Step by Step Solution

There are 3 Steps involved in it

1 Expert Approved Answer
Step: 1 Unlock blur-text-image
Question Has Been Solved by an Expert!

Get step-by-step solutions from verified subject matter experts

Step: 2 Unlock
Step: 3 Unlock

Students Have Also Explored These Related General Management Questions!