

Question: (a) A time series model is simulated with 1000 samples. The figures follow show the sample ACF and sample PACF. -0.2 0.2 0.6 1.0 ACF
(a) A time series model is simulated with 1000 samples. The figures follow show the sample ACF and sample PACF.
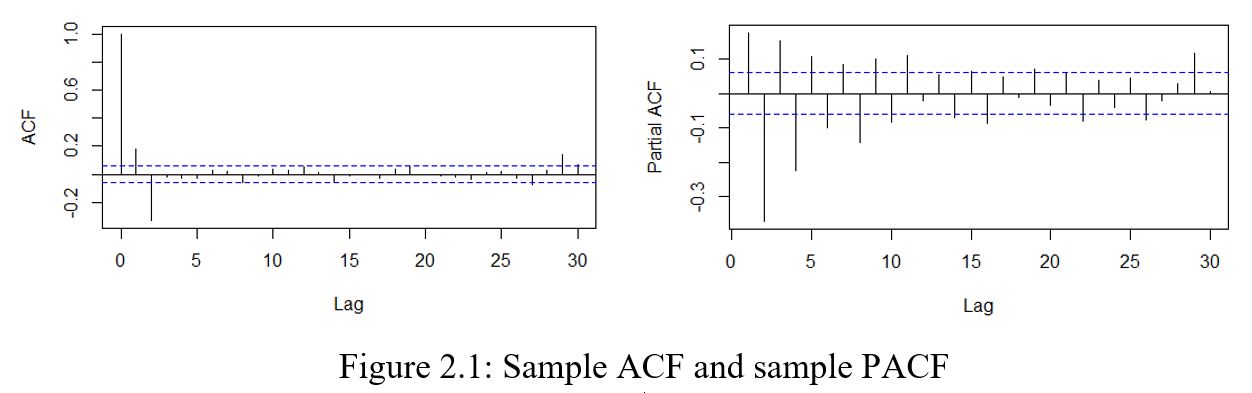
-0.2 0.2 0.6 1.0 ACF Partial ACF -0.1 -0.3 0 5 10 15 20 25 30 0 5 10 15 20 25 30 Lag Lag Figure 2.1: Sample ACF and sample PACE
Step by Step Solution
There are 3 Steps involved in it
1 Expert Approved Answer
Step: 1 Unlock

Question Has Been Solved by an Expert!
Get step-by-step solutions from verified subject matter experts
Step: 2 Unlock
Step: 3 Unlock