

Question: A) According to Exhibit 2, which is an analysis by Kimi Ford, fair equity value per share is $37.27. Analyze how she has arrived at
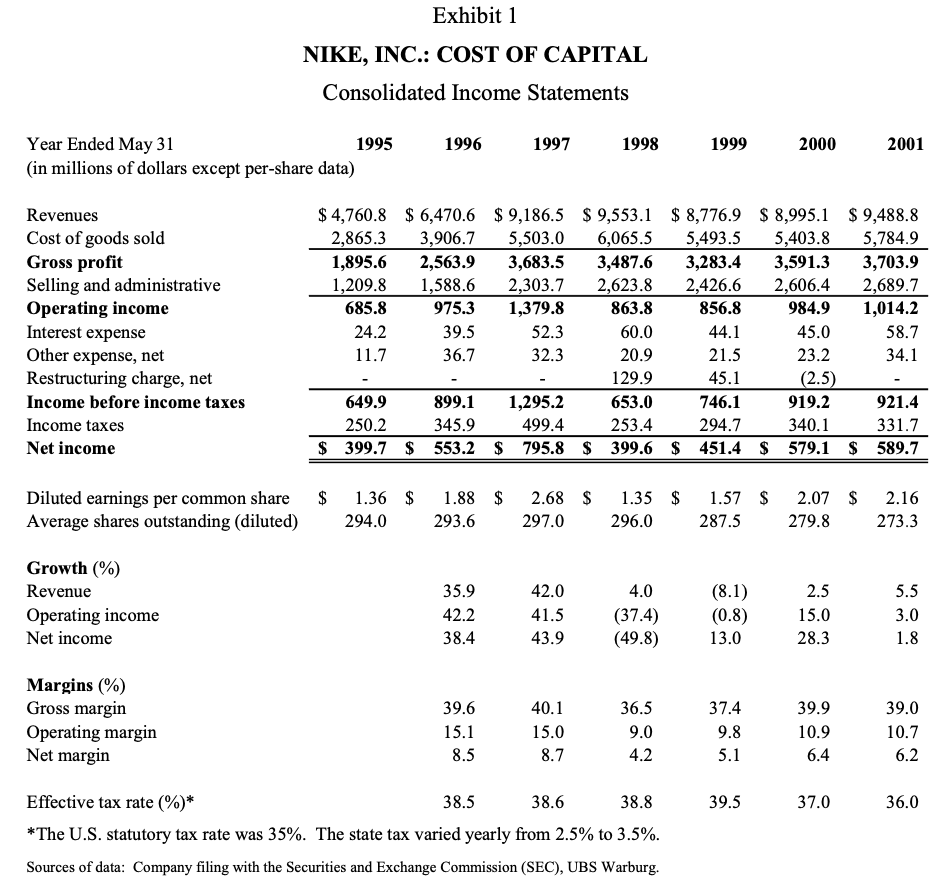
A) According to Exhibit 2, which is an analysis by Kimi Ford, fair equity value per share is $37.27. Analyze how she has arrived at this number. Specifically, consider the following;
- How did Kimi forecast sales revenue from years 2002 to 2011?
- How did she forecast cost of sales?
- How did she forecast SG&A (sales general and administrative) expenses?
- How did she forecast capex and depreciation expense? (Hint: why are they considered equal?)
- What is Terminal Value of $17,998.3? How did she estimate it? (Hint: show me a formula to obtain $17,998.3)
- What is Enterprise value? Why did she subtract current outstanding debt from enterprise value to estimate equity value?
- Her estimate of equity value per share is $37.27, whereas current share price is $42.09. Does this mean that share price is overvalued and Kimi should not invest in the stock?
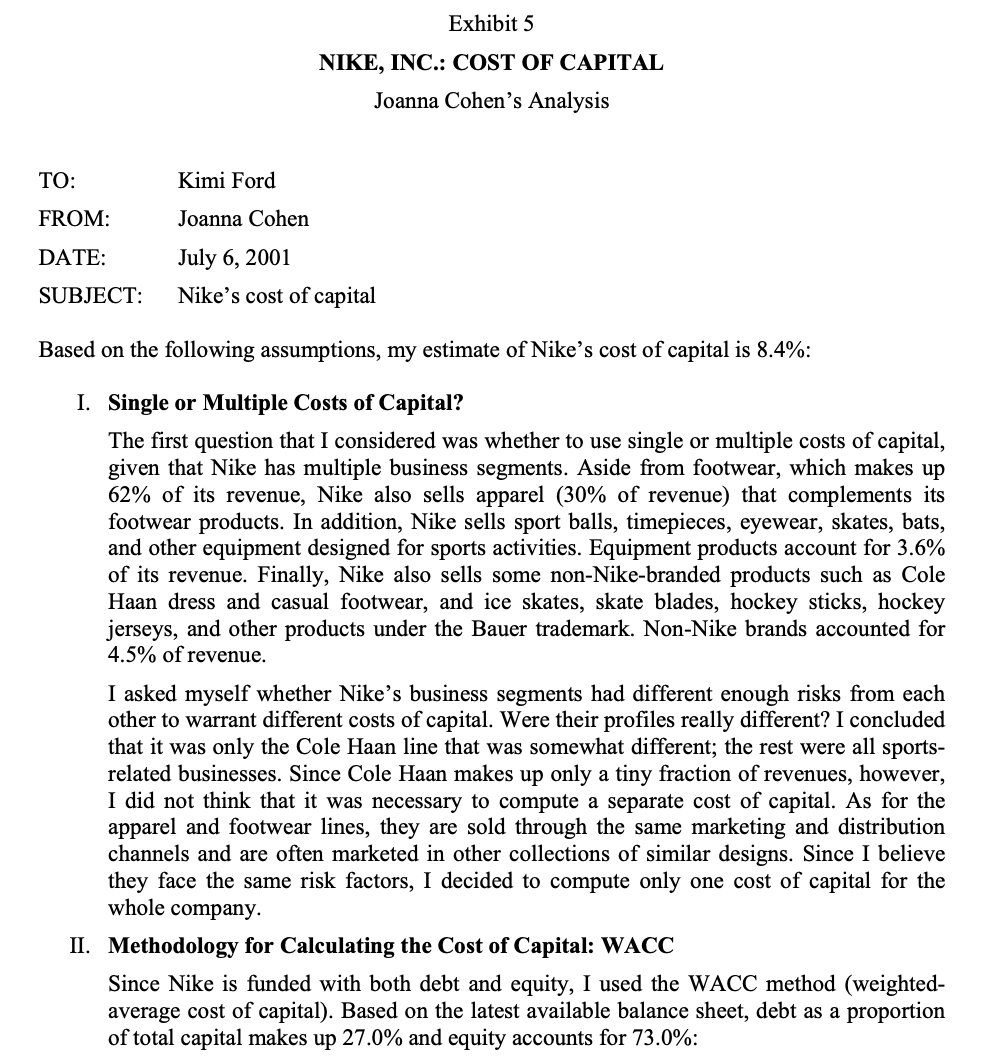
B) Analyze Joanna Cohens analysis shown in Exhibit 5, using information in Exhibits 3 and 4, and other information given in the case. Specifically, consider the following.
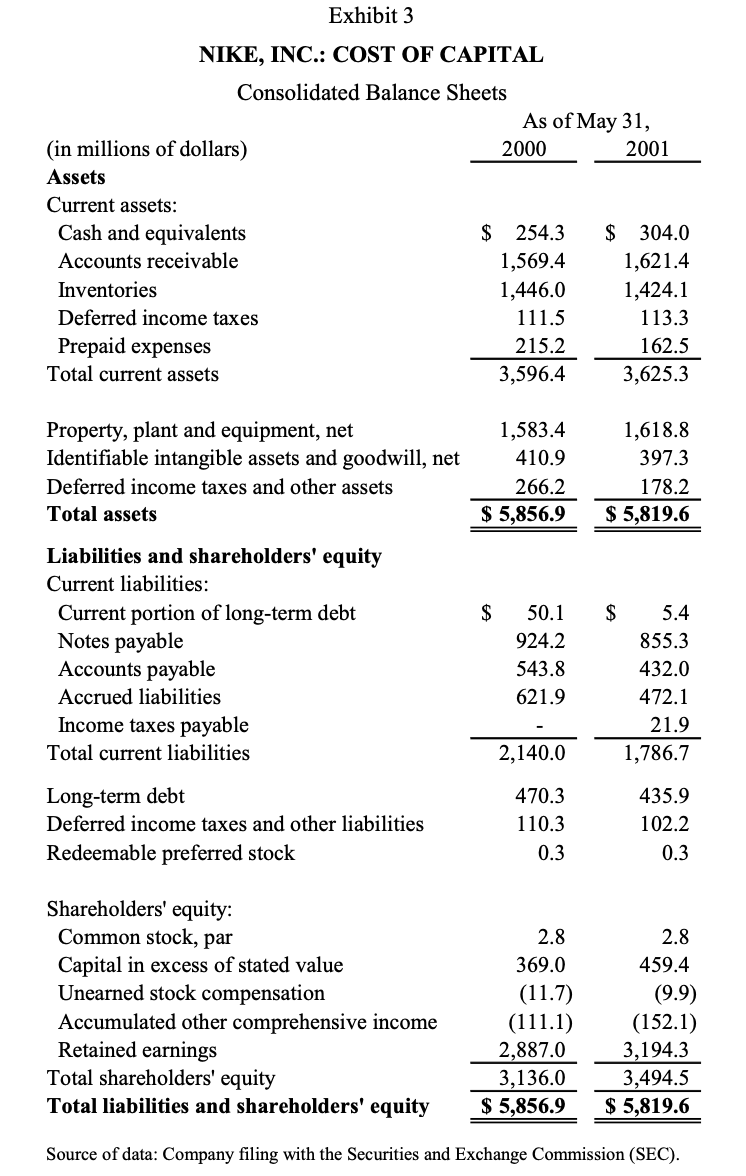
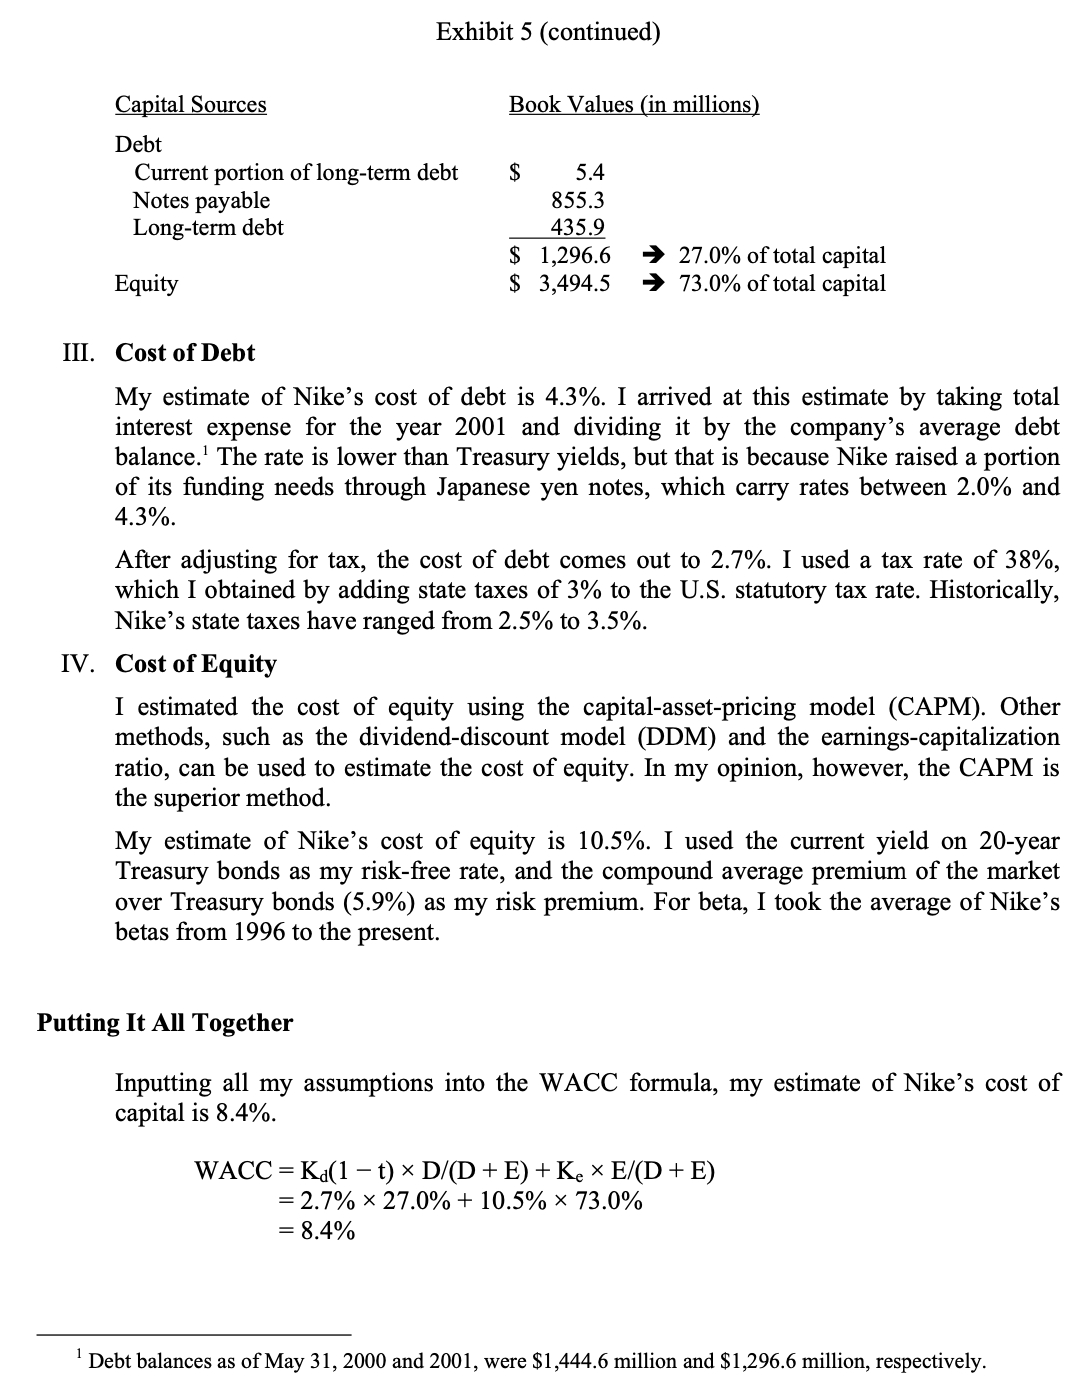
- Joanna estimates 27.0% of total capital is debt and 73.0% of total capital is equity. Is this a correct estimate?
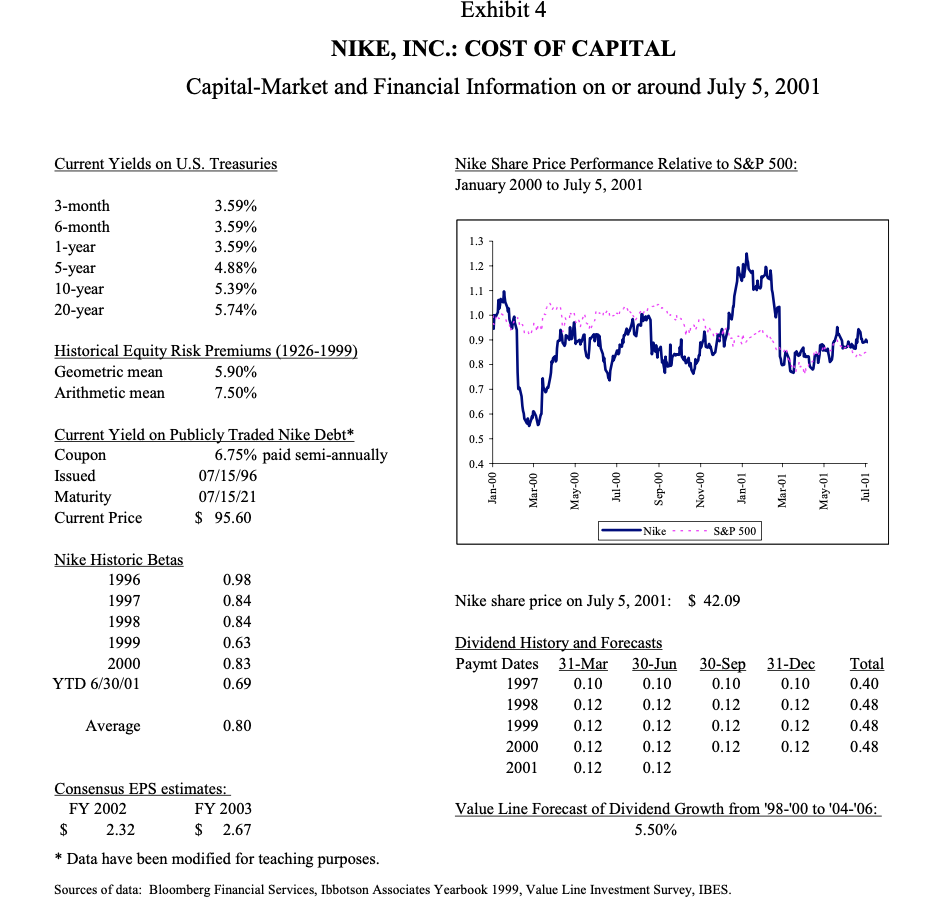
- Joanna estimates Nikes cost of debt is 4.3%. Is this a good estimate? If not, what is your estimate?
- Joanna estimates Nikes cost of equity is 10.5%. Is this a good estimate? If not, what is your estimate?
C) Should Kimi Ford buy Nikes stock?
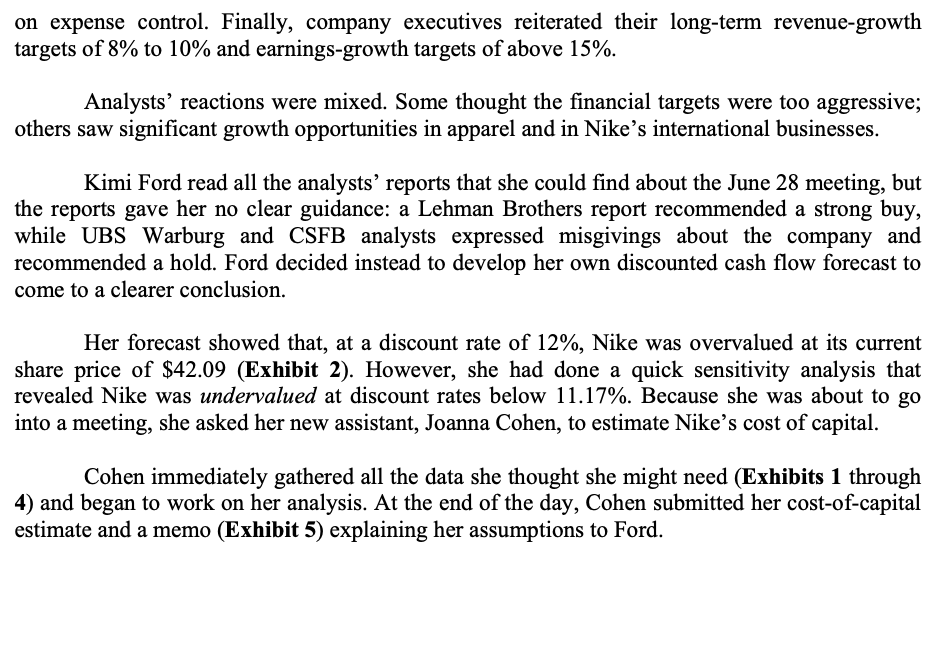
On July 5, 2001, Kimi Ford, a portfolio manager at NorthPoint Group, a mutual-fund management firm, pored over analysts' write-ups of Nike, Inc., the athletic-shoe manufacturer. Nike's share price had declined significantly from the beginning of the year. Ford was considering buying some shares for the fund she managed, the NorthPoint Large-Cap Fund, which invested mostly in Fortune 500 companies, with an emphasis on value investing. Its top holdings included ExxonMobil, General Motors, McDonald's, 3M, and other large-cap, generally old-economy stocks. While the stock market had declined over the last 18 months, the NorthPoint Large-Cap Fund had performed extremely well. In 2000, the fund earned a return of 20.7%, even as the S\&P 500 fell 10.1%. At the end of June 2001, the fund's year-to-date returns stood at 6.4% versus 7.3% for the S\&P 500 . Only a week earlier, on June 28, 2001, Nike had held an analysts' meeting to disclose its fiscal-year 2001 results. 1 The meeting, however, had another purpose: Nike management wanted to communicate a strategy for revitalizing the company. Since 1997, its revenues had plateaued at around $9 billion, while net income had fallen from almost $800 million to $580 million (see Exhibit 1). Nike's market share in U.S. athletic shoes had fallen from 48%, in 1997 , to 42% in 2000.2 In addition, recent supply-chain issues and the adverse effect of a strong dollar had negatively affected revenue. At the meeting, management revealed plans to address both top-line growth and operating performance. To boost revenue, the company would develop more athletic-shoe products in the midpriced segment 3 - a segment that Nike had overlooked in recent years. Nike also planned to push its apparel line, which, under the recent leadership of industry veteran Mindy Grossman, 4 had performed extremely well. On the cost side, Nike would exert more effort on expense control. Finally, company executives reiterated their long-term revenue-growth targets of 8% to 10% and earnings-growth targets of above 15%. Analysts' reactions were mixed. Some thought the financial targets were too aggressive; others saw significant growth opportunities in apparel and in Nike's international businesses. Kimi Ford read all the analysts' reports that she could find about the June 28 meeting, but the reports gave her no clear guidance: a Lehman Brothers report recommended a strong buy, while UBS Warburg and CSFB analysts expressed misgivings about the company and recommended a hold. Ford decided instead to develop her own discounted cash flow forecast to come to a clearer conclusion. Her forecast showed that, at a discount rate of 12%, Nike was overvalued at its current share price of $42.09 (Exhibit 2). However, she had done a quick sensitivity analysis that revealed Nike was undervalued at discount rates below 11.17%. Because she was about to go into a meeting, she asked her new assistant, Joanna Cohen, to estimate Nike's cost of capital. Cohen immediately gathered all the data she thought she might need (Exhibits 1 through 4) and began to work on her analysis. At the end of the day, Cohen submitted her cost-of-capital estimate and a memo (Exhibit 5) explaining her assumptions to Ford. NIKE, INC.: COST OF CAPITAL Consolidated Income Statements Sources of data: Company filing with the Securities and Exchange Commission (SEC), UBS Warburg. Frhihit? Exhibit 3 Capital-Market and Financial Information on or around July 5, 2001 Nike Share Price Performance Relative to S\&P 500: January 2000 to July 5, 2001 Nike share price on July 5,2001:$42.09 Value Line Forecast of Dividend Growth from '98-'00 to '04-'06: 5.50% * Data have been modified for teaching purposes. Sources of data: Bloomberg Financial Services, Ibbotson Associates Yearbook 1999, Value Line Investment Survey, IBES. Exhibit 5 NIKE, INC.: COST OF CAPITAL Joanna Cohen's Analysis 3ased on the following assumptions, my estimate of Nike's cost of capital is 8.4% : I. Single or Multiple Costs of Capital? The first question that I considered was whether to use single or multiple costs of capital, given that Nike has multiple business segments. Aside from footwear, which makes up 62% of its revenue, Nike also sells apparel ( 30% of revenue) that complements its footwear products. In addition, Nike sells sport balls, timepieces, eyewear, skates, bats, and other equipment designed for sports activities. Equipment products account for 3.6% of its revenue. Finally, Nike also sells some non-Nike-branded products such as Cole Haan dress and casual footwear, and ice skates, skate blades, hockey sticks, hockey jerseys, and other products under the Bauer trademark. Non-Nike brands accounted for 4.5% of revenue. I asked myself whether Nike's business segments had different enough risks from each other to warrant different costs of capital. Were their profiles really different? I concluded that it was only the Cole Haan line that was somewhat different; the rest were all sportsrelated businesses. Since Cole Haan makes up only a tiny fraction of revenues, however, I did not think that it was necessary to compute a separate cost of capital. As for the apparel and footwear lines, they are sold through the same marketing and distribution channels and are often marketed in other collections of similar designs. Since I believe they face the same risk factors, I decided to compute only one cost of capital for the whole company. II. Methodology for Calculating the Cost of Capital: WACC Since Nike is funded with both debt and equity, I used the WACC method (weightedaverage cost of capital). Based on the latest available balance sheet, debt as a proportion of total capital makes up 27.0% and equity accounts for 73.0% : Exhibit 5 (continued) III. Cost of Debt My estimate of Nike's cost of debt is 4.3%. I arrived at this estimate by taking total interest expense for the year 2001 and dividing it by the company's average debt balance. 1 The rate is lower than Treasury yields, but that is because Nike raised a portion of its funding needs through Japanese yen notes, which carry rates between 2.0% and 4.3%. After adjusting for tax, the cost of debt comes out to 2.7%. I used a tax rate of 38%, which I obtained by adding state taxes of 3% to the U.S. statutory tax rate. Historically, Nike's state taxes have ranged from 2.5% to 3.5%. IV. Cost of Equity I estimated the cost of equity using the capital-asset-pricing model (CAPM). Other methods, such as the dividend-discount model (DDM) and the earnings-capitalization ratio, can be used to estimate the cost of equity. In my opinion, however, the CAPM is the superior method. My estimate of Nike's cost of equity is 10.5%. I used the current yield on 20-year Treasury bonds as my risk-free rate, and the compound average premium of the market over Treasury bonds (5.9%) as my risk premium. For beta, I took the average of Nike's betas from 1996 to the present. Putting It All Together Inputting all my assumptions into the WACC formula, my estimate of Nike's cost of capital is 8.4%. WACC=Kd(1t)D/(D+E)+KeE/(D+E)=2.7%27.0%+10.5%73.0%=8.4% 1 Debt balances as of May 31, 2000 and 2001, were $1,444.6 million and $1,296.6 million, respectively. On July 5, 2001, Kimi Ford, a portfolio manager at NorthPoint Group, a mutual-fund management firm, pored over analysts' write-ups of Nike, Inc., the athletic-shoe manufacturer. Nike's share price had declined significantly from the beginning of the year. Ford was considering buying some shares for the fund she managed, the NorthPoint Large-Cap Fund, which invested mostly in Fortune 500 companies, with an emphasis on value investing. Its top holdings included ExxonMobil, General Motors, McDonald's, 3M, and other large-cap, generally old-economy stocks. While the stock market had declined over the last 18 months, the NorthPoint Large-Cap Fund had performed extremely well. In 2000, the fund earned a return of 20.7%, even as the S\&P 500 fell 10.1%. At the end of June 2001, the fund's year-to-date returns stood at 6.4% versus 7.3% for the S\&P 500 . Only a week earlier, on June 28, 2001, Nike had held an analysts' meeting to disclose its fiscal-year 2001 results. 1 The meeting, however, had another purpose: Nike management wanted to communicate a strategy for revitalizing the company. Since 1997, its revenues had plateaued at around $9 billion, while net income had fallen from almost $800 million to $580 million (see Exhibit 1). Nike's market share in U.S. athletic shoes had fallen from 48%, in 1997 , to 42% in 2000.2 In addition, recent supply-chain issues and the adverse effect of a strong dollar had negatively affected revenue. At the meeting, management revealed plans to address both top-line growth and operating performance. To boost revenue, the company would develop more athletic-shoe products in the midpriced segment 3 - a segment that Nike had overlooked in recent years. Nike also planned to push its apparel line, which, under the recent leadership of industry veteran Mindy Grossman, 4 had performed extremely well. On the cost side, Nike would exert more effort on expense control. Finally, company executives reiterated their long-term revenue-growth targets of 8% to 10% and earnings-growth targets of above 15%. Analysts' reactions were mixed. Some thought the financial targets were too aggressive; others saw significant growth opportunities in apparel and in Nike's international businesses. Kimi Ford read all the analysts' reports that she could find about the June 28 meeting, but the reports gave her no clear guidance: a Lehman Brothers report recommended a strong buy, while UBS Warburg and CSFB analysts expressed misgivings about the company and recommended a hold. Ford decided instead to develop her own discounted cash flow forecast to come to a clearer conclusion. Her forecast showed that, at a discount rate of 12%, Nike was overvalued at its current share price of $42.09 (Exhibit 2). However, she had done a quick sensitivity analysis that revealed Nike was undervalued at discount rates below 11.17%. Because she was about to go into a meeting, she asked her new assistant, Joanna Cohen, to estimate Nike's cost of capital. Cohen immediately gathered all the data she thought she might need (Exhibits 1 through 4) and began to work on her analysis. At the end of the day, Cohen submitted her cost-of-capital estimate and a memo (Exhibit 5) explaining her assumptions to Ford. NIKE, INC.: COST OF CAPITAL Consolidated Income Statements Sources of data: Company filing with the Securities and Exchange Commission (SEC), UBS Warburg. Frhihit? Exhibit 3 Capital-Market and Financial Information on or around July 5, 2001 Nike Share Price Performance Relative to S\&P 500: January 2000 to July 5, 2001 Nike share price on July 5,2001:$42.09 Value Line Forecast of Dividend Growth from '98-'00 to '04-'06: 5.50% * Data have been modified for teaching purposes. Sources of data: Bloomberg Financial Services, Ibbotson Associates Yearbook 1999, Value Line Investment Survey, IBES. Exhibit 5 NIKE, INC.: COST OF CAPITAL Joanna Cohen's Analysis 3ased on the following assumptions, my estimate of Nike's cost of capital is 8.4% : I. Single or Multiple Costs of Capital? The first question that I considered was whether to use single or multiple costs of capital, given that Nike has multiple business segments. Aside from footwear, which makes up 62% of its revenue, Nike also sells apparel ( 30% of revenue) that complements its footwear products. In addition, Nike sells sport balls, timepieces, eyewear, skates, bats, and other equipment designed for sports activities. Equipment products account for 3.6% of its revenue. Finally, Nike also sells some non-Nike-branded products such as Cole Haan dress and casual footwear, and ice skates, skate blades, hockey sticks, hockey jerseys, and other products under the Bauer trademark. Non-Nike brands accounted for 4.5% of revenue. I asked myself whether Nike's business segments had different enough risks from each other to warrant different costs of capital. Were their profiles really different? I concluded that it was only the Cole Haan line that was somewhat different; the rest were all sportsrelated businesses. Since Cole Haan makes up only a tiny fraction of revenues, however, I did not think that it was necessary to compute a separate cost of capital. As for the apparel and footwear lines, they are sold through the same marketing and distribution channels and are often marketed in other collections of similar designs. Since I believe they face the same risk factors, I decided to compute only one cost of capital for the whole company. II. Methodology for Calculating the Cost of Capital: WACC Since Nike is funded with both debt and equity, I used the WACC method (weightedaverage cost of capital). Based on the latest available balance sheet, debt as a proportion of total capital makes up 27.0% and equity accounts for 73.0% : Exhibit 5 (continued) III. Cost of Debt My estimate of Nike's cost of debt is 4.3%. I arrived at this estimate by taking total interest expense for the year 2001 and dividing it by the company's average debt balance. 1 The rate is lower than Treasury yields, but that is because Nike raised a portion of its funding needs through Japanese yen notes, which carry rates between 2.0% and 4.3%. After adjusting for tax, the cost of debt comes out to 2.7%. I used a tax rate of 38%, which I obtained by adding state taxes of 3% to the U.S. statutory tax rate. Historically, Nike's state taxes have ranged from 2.5% to 3.5%. IV. Cost of Equity I estimated the cost of equity using the capital-asset-pricing model (CAPM). Other methods, such as the dividend-discount model (DDM) and the earnings-capitalization ratio, can be used to estimate the cost of equity. In my opinion, however, the CAPM is the superior method. My estimate of Nike's cost of equity is 10.5%. I used the current yield on 20-year Treasury bonds as my risk-free rate, and the compound average premium of the market over Treasury bonds (5.9%) as my risk premium. For beta, I took the average of Nike's betas from 1996 to the present. Putting It All Together Inputting all my assumptions into the WACC formula, my estimate of Nike's cost of capital is 8.4%. WACC=Kd(1t)D/(D+E)+KeE/(D+E)=2.7%27.0%+10.5%73.0%=8.4% 1 Debt balances as of May 31, 2000 and 2001, were $1,444.6 million and $1,296.6 million, respectively
Step by Step Solution
There are 3 Steps involved in it

Get step-by-step solutions from verified subject matter experts