

Question: (a) Apply your linear regression model using gradient descent to find the best fit of the data given by: x = np.array([ 0., 1.66666667,
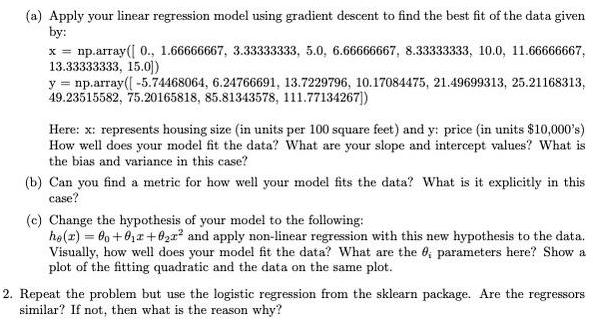
(a) Apply your linear regression model using gradient descent to find the best fit of the data given by: x = np.array([ 0., 1.66666667, 3.33333333, 5.0, 6.66666667, 8.33333333, 10.0, 11.66666667, 13.33333333, 15.0]) y = np.array([-5.74468064, 6.24766691, 13.7229796, 10.17084475, 21.49699313, 25.21168313, 49.23515582, 75.20165818, 85.81343578, 111.77134267]) Here: x: represents housing size (in units per 100 square feet) and y: price (in units $10,000's) How well does your model fit the data? What are your slope and intercept values? What is the bias and variance in this case? (b) Can you find a metric for how well your model fits the data? What is it explicitly in this case? (c) Change the hypothesis of your model to the following: he(x)=00+01+0222 and apply non-linear regression with this new hypothesis to the data. Visually, how well does your model fit the data? What are the 0; parameters here? Show a plot of the fitting quadratic and the data on the same plot. 2. Repeat the problem but use the logistic regression from the sklearn package. Are the regressors similar? If not, then what is the reason why?
Step by Step Solution
There are 3 Steps involved in it

Get step-by-step solutions from verified subject matter experts