

Question: A B 1234567890123456 1 Date ETH C BITC D E F G H K M N P Q R S TSX 201508 1.254864 227.1808
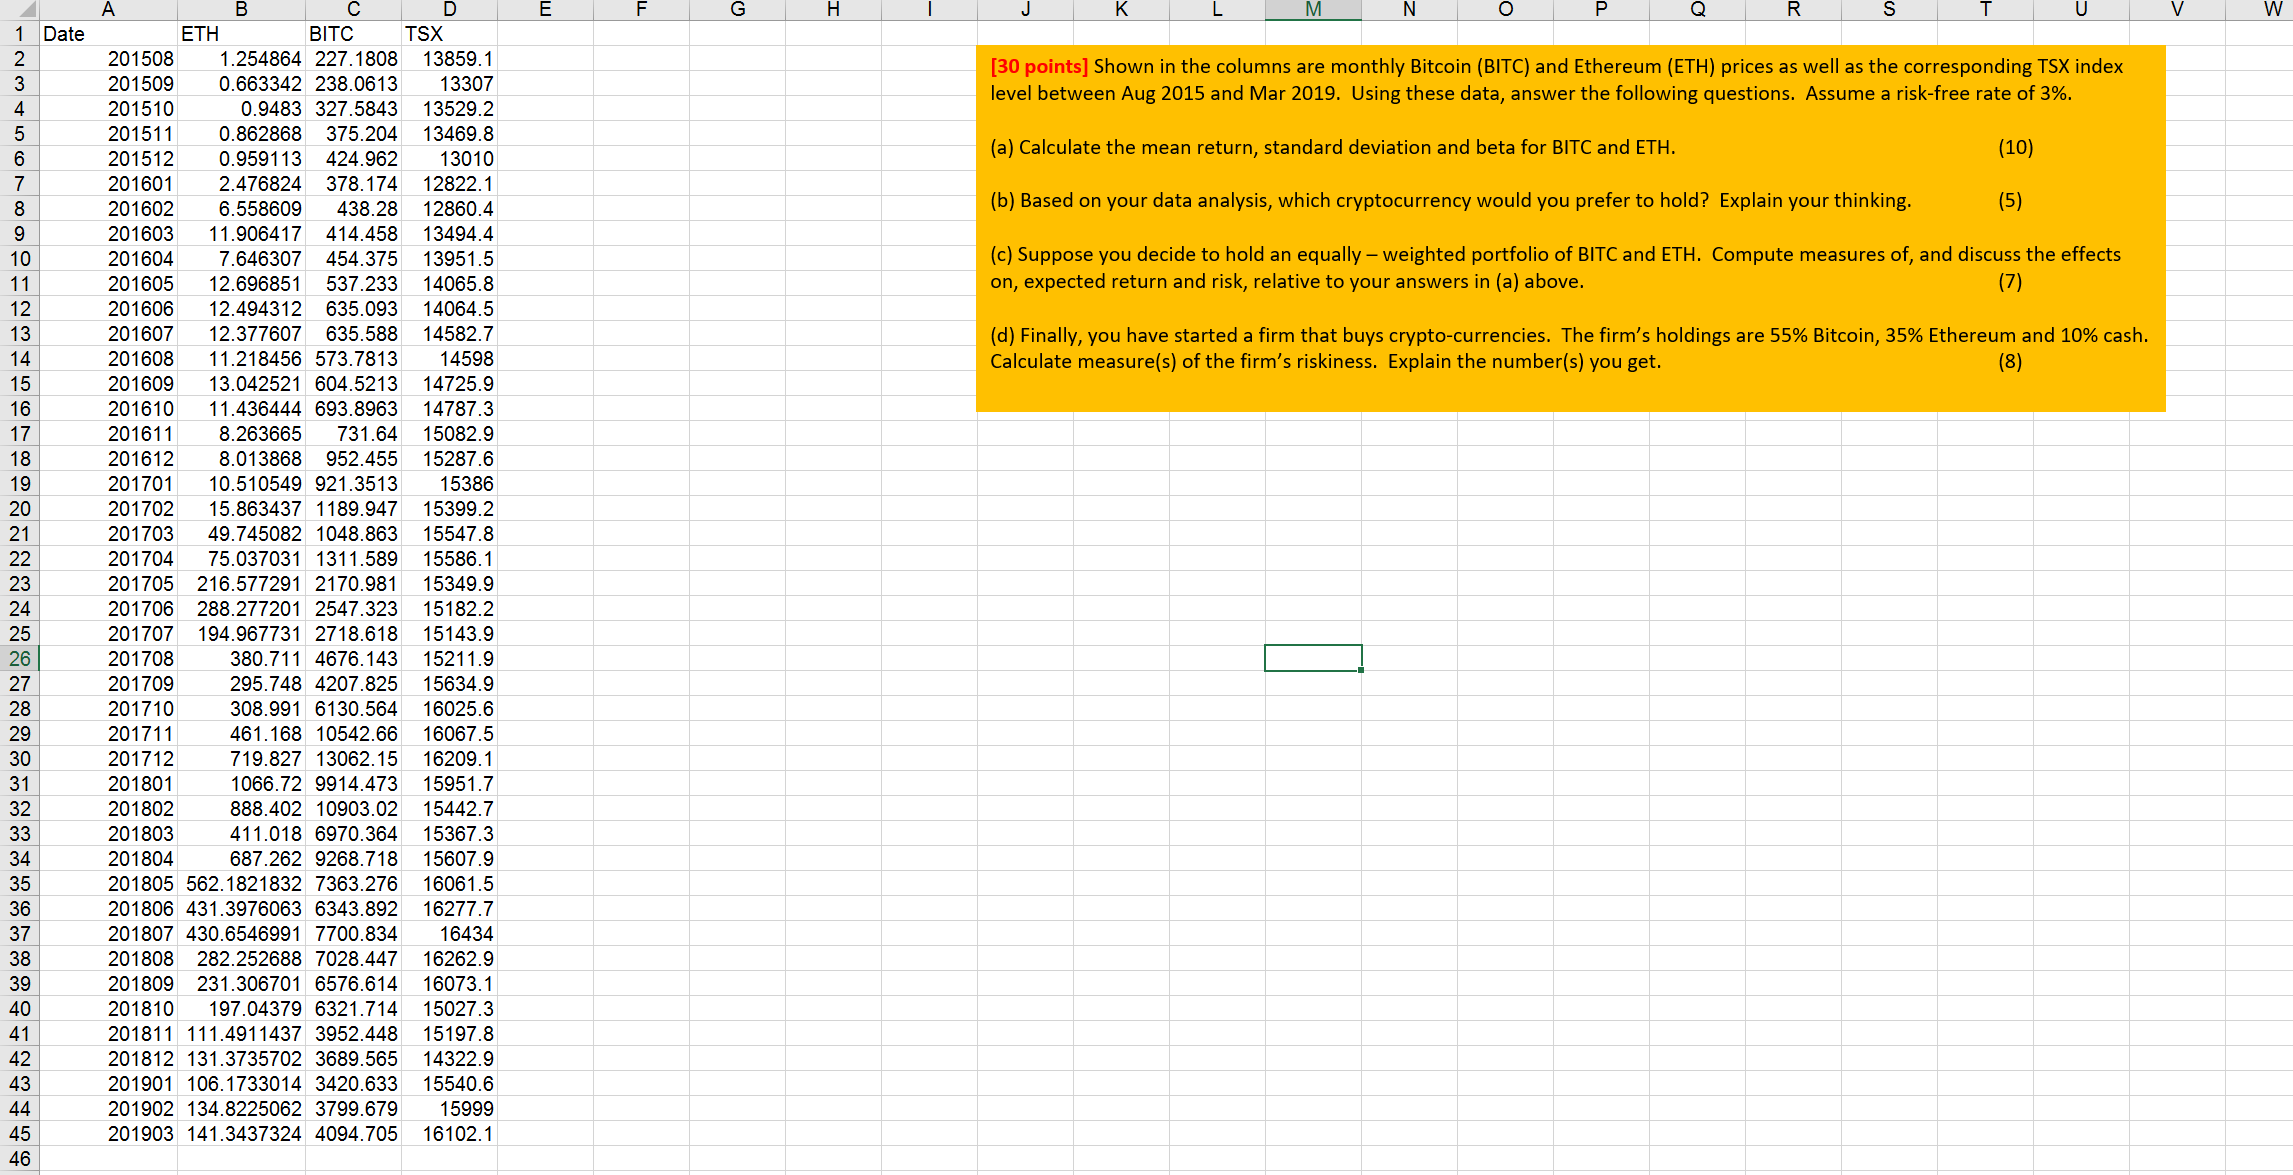
A B 1234567890123456 1 Date ETH C BITC D E F G H K M N P Q R S TSX 201508 1.254864 227.1808 13859.1 201509 201510 201608 13307 0.9483 327.5843 13529.2 201511 0.862868 375.204 13469.8 201512 0.959113 424.962 13010 201601 2.476824 378.174 12822.1 201602 438.28 6.558609 12860.4 201603 11.906417 414.458 13494.4 201604 7.646307 454.375 13951.5 201605 12.696851 537.233 14065.8 201606 12.494312 635.093 14064.5 201607 12.377607 635.588 14582.7 11.218456 573.7813 0.663342 238.0613 [30 points] Shown in the columns are monthly Bitcoin (BITC) and Ethereum (ETH) prices as well as the corresponding TSX index level between Aug 2015 and Mar 2019. Using these data, answer the following questions. Assume a risk-free rate of 3%. (a) Calculate the mean return, standard deviation and beta for BITC and ETH. (10) (b) Based on your data analysis, which cryptocurrency would you prefer to hold? Explain your thinking. (5) (c) Suppose you decide to hold an equally - weighted portfolio of BITC and ETH. Compute measures of, and discuss the effects on, expected return and risk, relative to your answers in (a) above. (7) 14598 (d) Finally, you have started a firm that buys crypto-currencies. The firm's holdings are 55% Bitcoin, 35% Ethereum and 10% cash. Calculate measure(s) of the firm's riskiness. Explain the number(s) you get. (8) 201609 16 201610 13.042521 604.5213 11.436444 693.8963 17 18 19 20 201702 21 201703 201704 45 622222222222333EMERGE23444 25 201708 27 201709 380.711 4676.143 15211.9 295.748 4207.825 15634.9 28 201710 29 201711 30 201712 31 201801 201802 201803 201804 308.991 6130.564 16025.6 461.168 10542.66 16067.5 719.827 13062.15 16209.1 1066.72 9914.473 15951.7 888.402 10903.02 15442.7 411.018 6970.364 15367.3 687.262 9268.718 15607.9 35 37 201805 562.1821832 7363.276 16061.5 201806 431.3976063 6343.892 16277.7 201807 430.6546991 7700.834 16434 38 201808 39 40 201810 282.252688 7028.447 16262.9 201809 231.306701 6576.614 16073.1 15027.3 197.04379 6321.714 41 201811 111.4911437 3952.448 15197.8 201812 131.3735702 3689.565 14322.9 15540.6 201901 106.1733014 3420.633 201902 134.8225062 3799.679 15999 16102.1 201903 141.3437324 4094.705 201611 201612 8.013868 952.455 15287.6 201701 10.510549 921.3513 15386 15.863437 1189.947 15399.2 49.745082 1048.863 15547.8 75.037031 1311.589 15586.1 201705 216.577291 2170.981 15349.9 15182.2 201706 288.277201 2547.323 201707 194.967731 2718.618 15143.9 8.263665 731.64 14725.9 14787.3 15082.9 W
Step by Step Solution
There are 3 Steps involved in it

Get step-by-step solutions from verified subject matter experts