

Question: A B C 1 Therapy Improvement Coded Improvement 2 CONTROL NO 0 3 CONTROL NO O 4 CONTROL NO 0 5 CONTROL NO 6 CONTROL
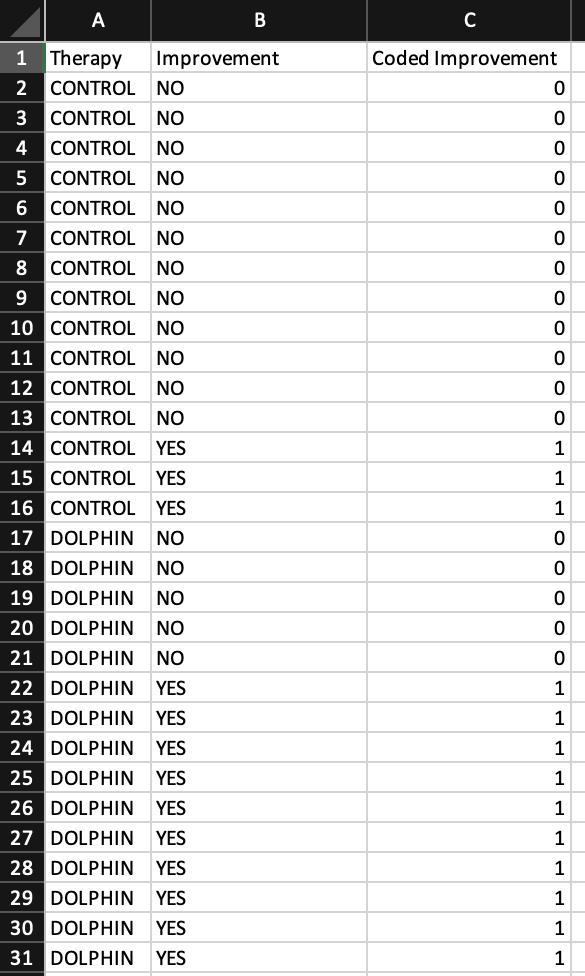


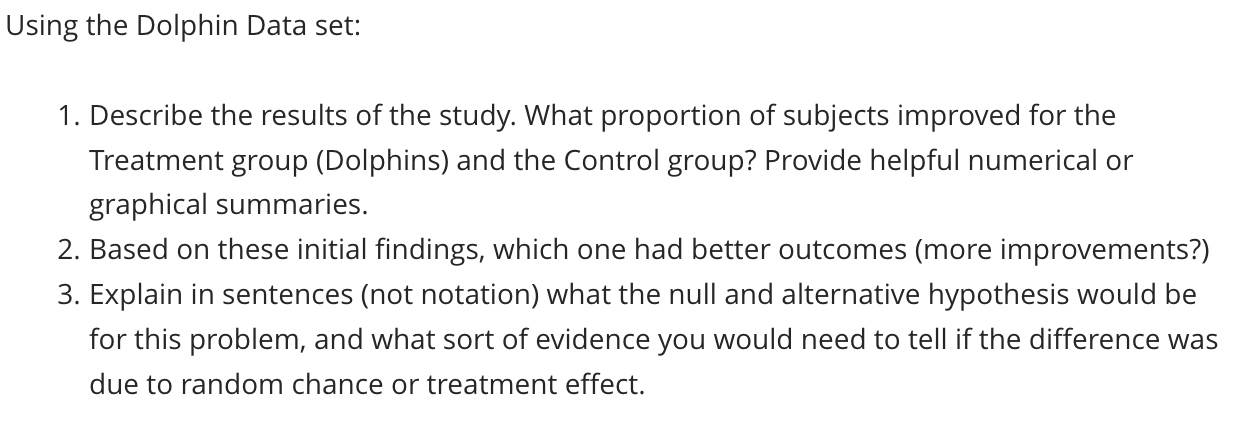
A B C 1 Therapy Improvement Coded Improvement 2 CONTROL NO 0 3 CONTROL NO O 4 CONTROL NO 0 5 CONTROL NO 6 CONTROL NO 7 CONTROL NO 8 CONTROL NO 9 CONTROL NO o o o OOO OOO 10 CONTROL NO 11 CONTROL NO 12 CONTROL NO 13 CONTROL NO 14 CONTROL YES 15 CONTROL YES 16 CONTROL YES 17 DOLPHIN NO 18 DOLPHIN NO 19 DOLPHIN NO 0 20 DOLPHIN NO 0 21 DOLPHIN NO O 22 DOLPHIN YES 23 DOLPHIN YES 24 DOLPHIN YES 1 25 DOLPHIN YES 1 26 DOLPHIN YES 1 27 DOLPHIN YES 1 28 DOLPHIN YES 1 29 DOLPHIN YES 30 DOLPHIN YES 1 31 DOLPHIN YESUsing the Dolphin Data set: 1. Describe the results of the study. What proportion of subjects improved for the Treatment group (Dolphins) and the Control group? Provide helpful numerical or graphical summaries. 2. Based on these initial findings, which one had better outcomes (more improvements?) 3. Explain in sentences (not notation) what the null and alternative hypothesis would be for this problem, and what sort of evidence you would need to tell if the difference was due to random chance or treatment effect
Step by Step Solution
There are 3 Steps involved in it

Get step-by-step solutions from verified subject matter experts