

Question: A B C D E 1 State % Obese State Average life expectancy in years 2 Alaska 30.7 Alaska 78.9 3 Arkansas 30.5 Arkansas 75.6
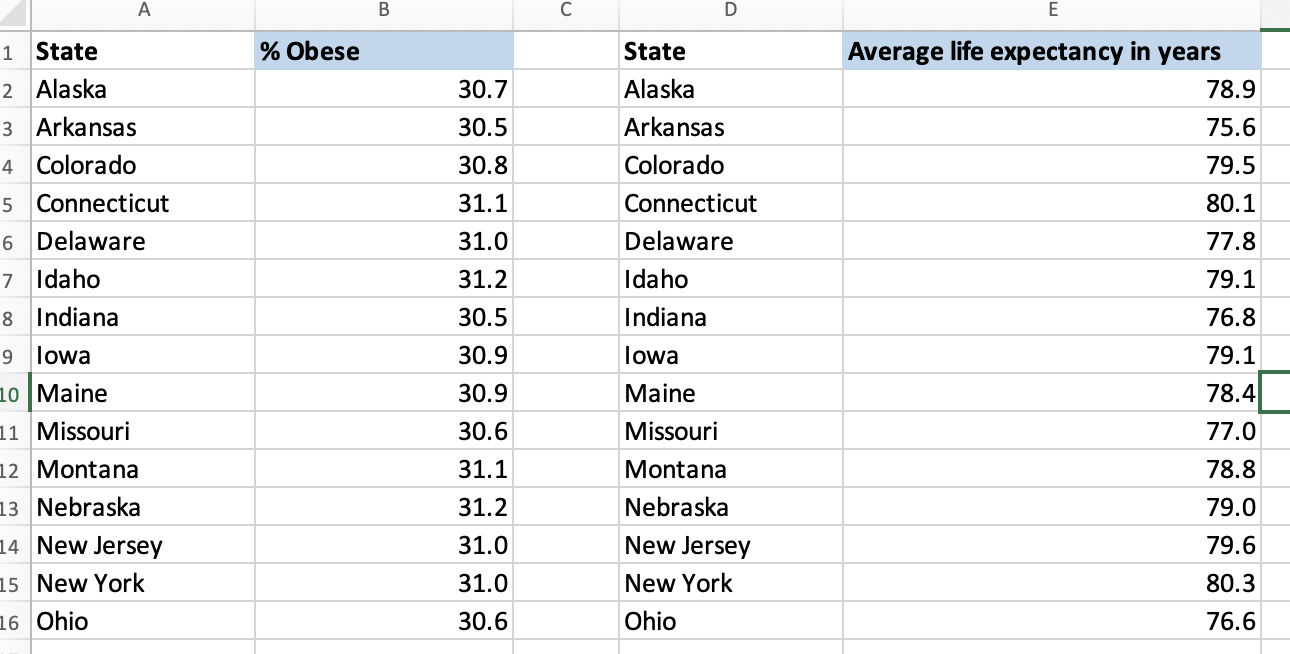
A B C D E 1 State % Obese State Average life expectancy in years 2 Alaska 30.7 Alaska 78.9 3 Arkansas 30.5 Arkansas 75.6 4 Colorado 30.8 Colorado 79.5 5 Connecticut 31.1 Connecticut 80.1 6 Delaware 31.0 Delaware 77.8 7 Idaho 31.2 Idaho 79.1 8 Indiana 30.5 Indiana 76.8 9 lowa 30.9 lowa 79.1 .0 Maine 30.9 Maine 78.4 11 Missouri 30.6 Missouri 77.0 12 Montana 31.1 Montana 78.8 13 Nebraska 31.2 Nebraska 79.0 14 New Jersey 31.0 New Jersey 79.6 15 New York 31.0 New York 80.3 16 Ohio 30.6 Ohio 76.6Apglication Assignment #5 20 goints Part 1) Life Expectancy and Obesity {16 points) Review the Health data given in the Excel spreadsheet, named as MATHZlS-DATA for Application Assignment-5. The variable of 56 Obesity is the percent of obese residents per state, and the Life Expectancy variable is the average life expectancy in years per state. 1. Create a scatterplot to see the relationship between the variables % Obese and Life Expectancy. [Hint: you might consider changing the x-axis scale] Copy and paste your graph here, and answer the following questions. a. What is the independent variable? b. What is the dependent variable? c. Does there seem to be a linear association between the two variables? 2. Find the correlation coefficient, r and describe the relationship between % Obese and Life Expectancy. Round your answer to 3 decimals. Is the relationship positive or negative; strong, moderate, or weak? 3. Find the equation of the estimated linear regression line, 9*. Write the equation below and sketch it on the scatter plot. 4. Ifthe %UbESE in a state is 30.5% what would you predict the average Life Expectancy of that state to be? (Use the estimated linear regression line, y, in question 3) 5. Can 45% Obese be used to estimate the average Life Expectancy for a state? Why or why not? 6. A. Choose one of the provided states in the Excel le and identify the %Obese and Life Expectancy in that state. What is the state you chose? What is the l3'60bese in that state? What is the Life Expectancy in that state? B. Find the estimated average Life Expectancy in this state using the estimated regression line 9. C. Is the estimated average Life Expectancy in this state higher or lower than the actual Life Expectancy? 7. By how much will Life Expectancy change with one unit increase in % Obese? 8. If the average Life Expectancy of a state is 75.9 years, what would you expect the %Obese of that state to be? (Use the estimated linear regression line, y, in question 3) Part 2) Student Interpretation and Reflection - 4 pts Write a summary of your learning from this assignment by addressing the following questions: Based on the analysis performed above, what can be said about the relationship between % Obese and the average Life Expectancy in years? How did the regression analysis you completed above help you understand the relationship? . Include a few sentences in your summary about whether %Obese and Life Expectancy have any causal relationship. Explain
Step by Step Solution
There are 3 Steps involved in it

Get step-by-step solutions from verified subject matter experts