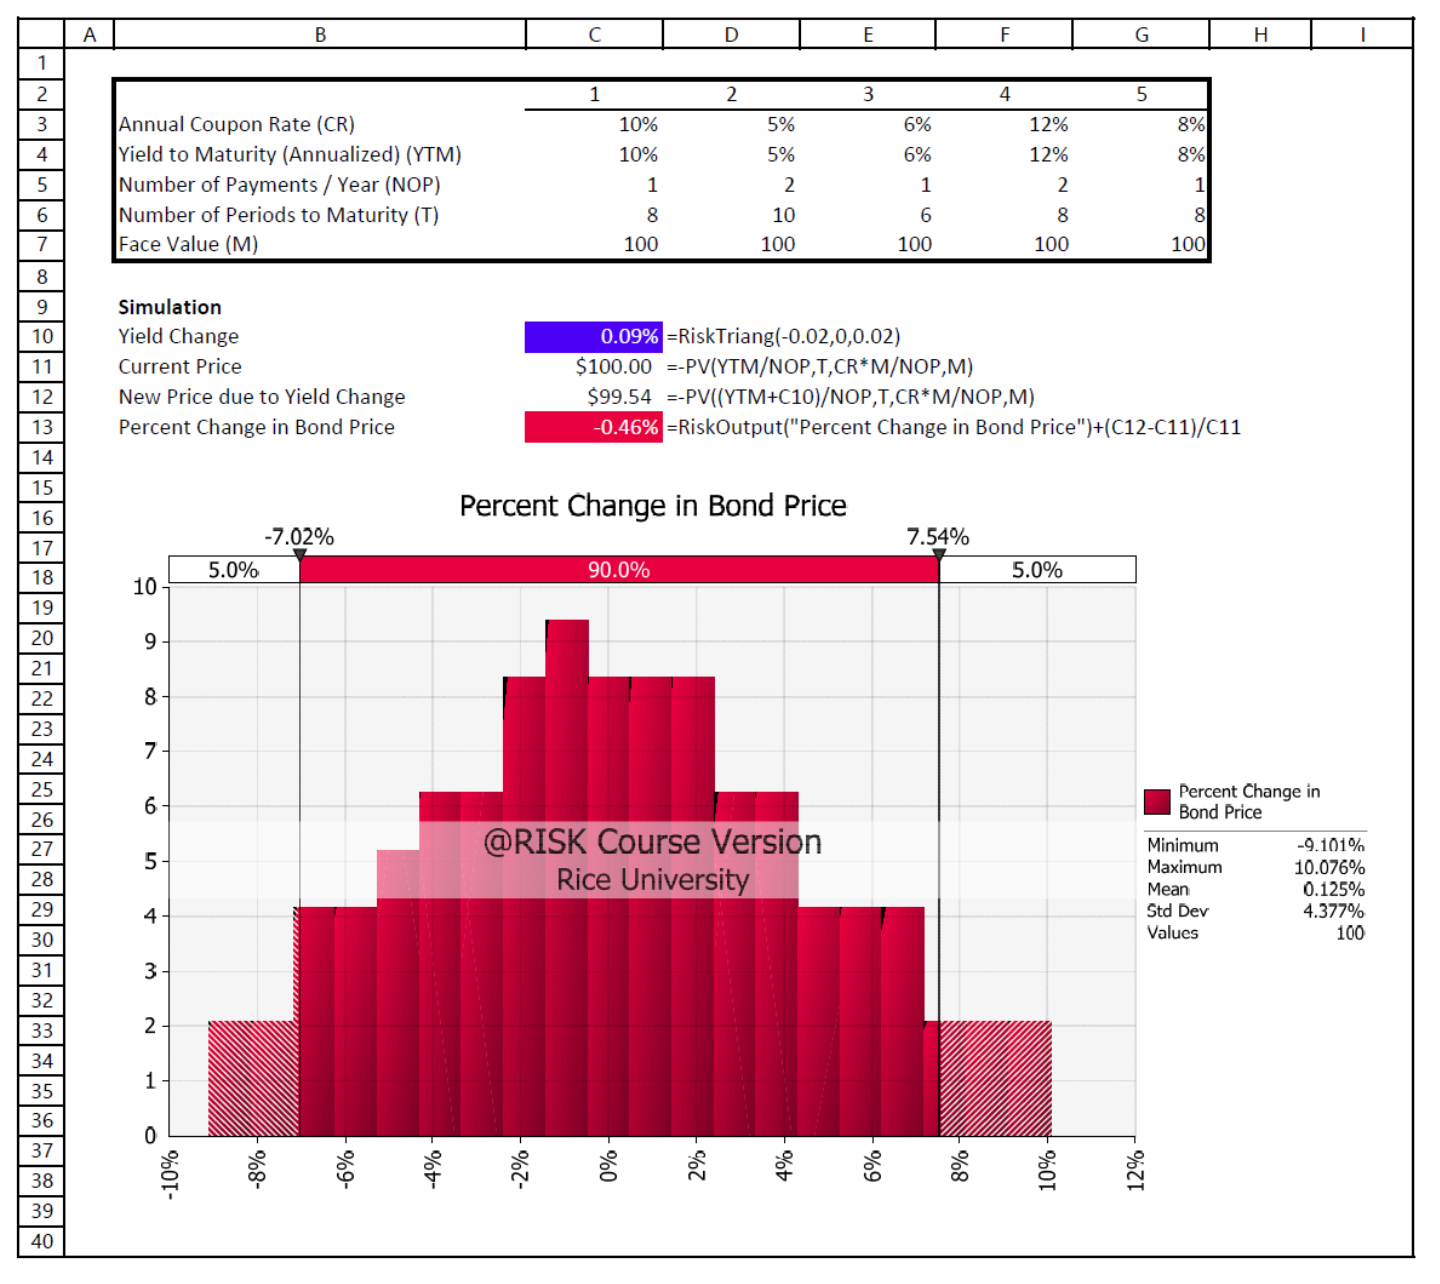
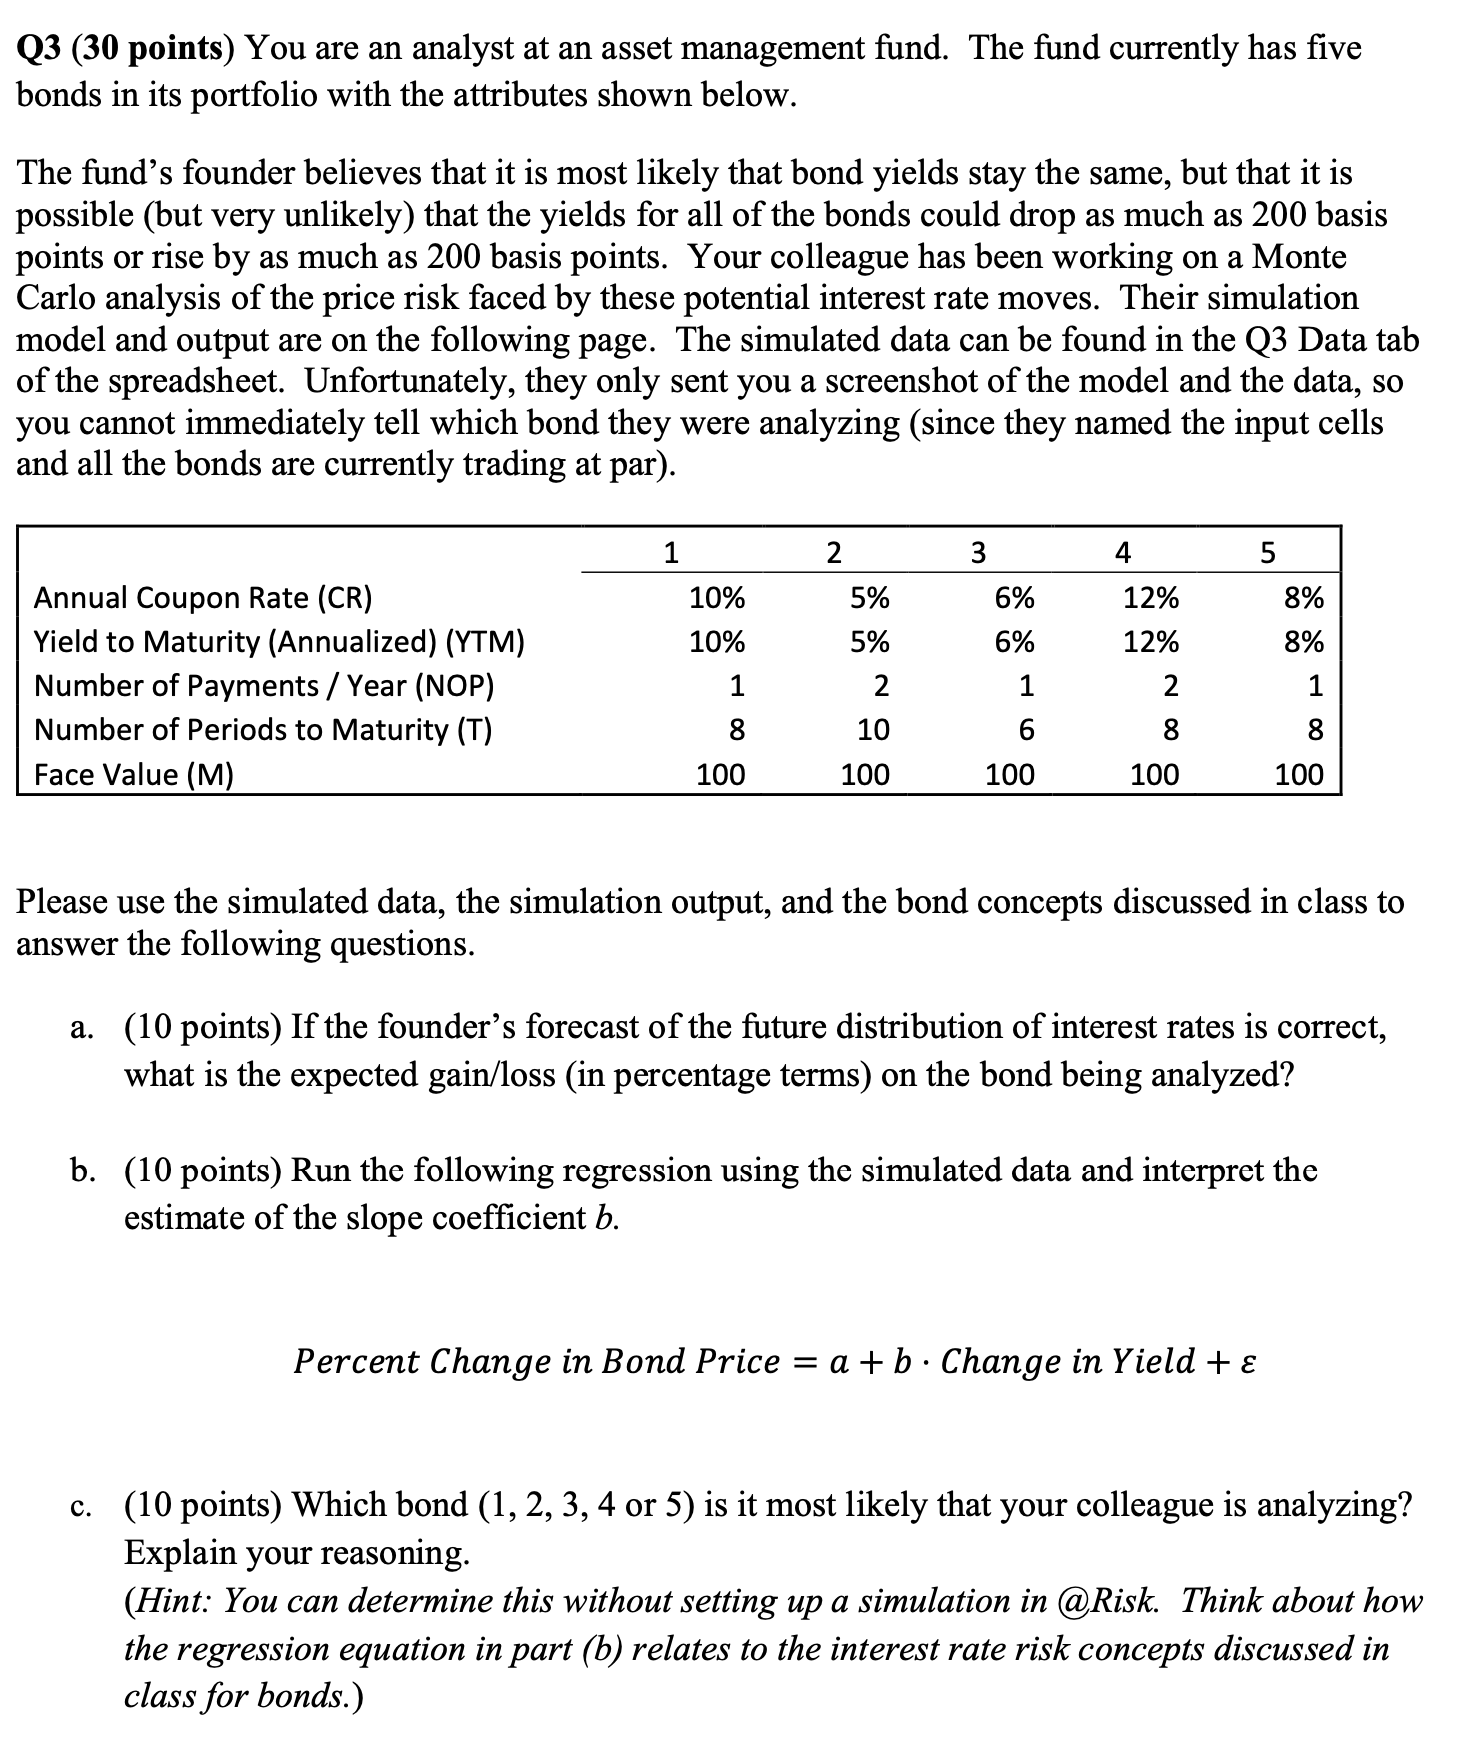
Question: A B C D E F G H 1 2 3 4 5 - W N Annual Coupon Rate (CR) 10% 5% 6% 12% 3%

A B C D E F G H 1 2 3 4 5 - W N Annual CouponA B C D E F G H 1 2 3 4 5 - W N Annual Coupon
A B C D E F G H 1 2 3 4 5 - W N Annual Coupon Rate (CR) 10% 5% 6% 12% 3% Yield to Maturity (Annualized) (YTM) 10% 5% 6% 12% 3% Number of Payments / Year (NOP) 1 2 1 2 Number of Periods to Maturity (T) 8 10 Face Value (M) 100 100 100 100 100 Simulation Yield Change 0.09% =RiskTriang(-0.02,0,0.02) Current Price $100.00 =-PV(YTM/NOP,T,CR*M/NOP,M) New Price due to Yield Change $99.54 =-PV((YTM+C10)/NOP, T,CR*M/NOP,M) Percent Change in Bond Price 0.46% =RiskOutput("Percent Change in Bond Price")+(C12-C11)/C11 15 Percent Change in Bond Price -7.02% 7.54% 18 5.0% 90.0% 5.0% 10 19 20 23 24 25 Percent Change in Bond Price 27 @RISK Course Version Minimum 9.101% UT 28 Rice University Maximum 10.076% Mean 0.125% A Std Dev 4.377% 30 Values 100 31 W 32 33 N 34 35 36 37 8% 2% 4% 6% -4% -2% 10% -6% -8% 12% 38 -10% 39 40Q3 (30 points) You are an analyst at an asset management fund. The fund currently has ve bonds in its portfolio with the attributes shown below. The lnd's founder believes that it is most likely that bond yields stay the same, but that it is possible (but very unlikely) that the yields for all of the bonds could drop as much as 200 basis points or rise by as much as 200 basis points. Your colleague has been working on a Monte Carlo analysis of the price risk faced by these potential interest rate moves. Their simulation model and output are on the following page. The simulated data can be found in the Q3 Data tab of the spreadsheet. Unfortunately, they only sent you a screenshot of the model and the data, so you cannot immediately tell which bond they were analyzing (since they named the input cells and all the bonds are currently trading at par). Annual Coupon Rate (CR) Yield to Maturity (Annualized) (YTM) Number of Payments / Year (NOP) Number of Periods to Maturity (T) Face Value (M) Please use the simulated data, the simulation output, and the bond concepts discussed in class to answer the following questions. a. (10 points) If the founder's forecast of the future distribution of interest rates is correct, what is the expected gain/loss (in percentage terms) on the bond being analyzed? b. (10 points) Run the following regression using the simulated data and interpret the estimate of the slope coefficient b. Percent Change in Band Price = a + b - Change in Yield + e c. (10 points) Which bond (1, 2, 3, 4 or 5) is it most likely that your colleague is analyzing? Explain your reasoning. (Hint: You can determine this without setting up a simulation in @Risk. Think about how the regression equation in part (b) relates to the interest rate risk concepts discussed in class for bonds.)

Step by Step Solution

There are 3 Steps involved in it

1 Expert Approved Answer
Step: 1 Unlock blur-text-image
Question Has Been Solved by an Expert!

Get step-by-step solutions from verified subject matter experts

Step: 2 Unlock
Step: 3 Unlock

Students Have Also Explored These Related Finance Questions!