Question: A B C D E F G H I J K L M N PCC FORECASTED FINANCIALS USING COMPANY FORECASTS (May) O P Q R
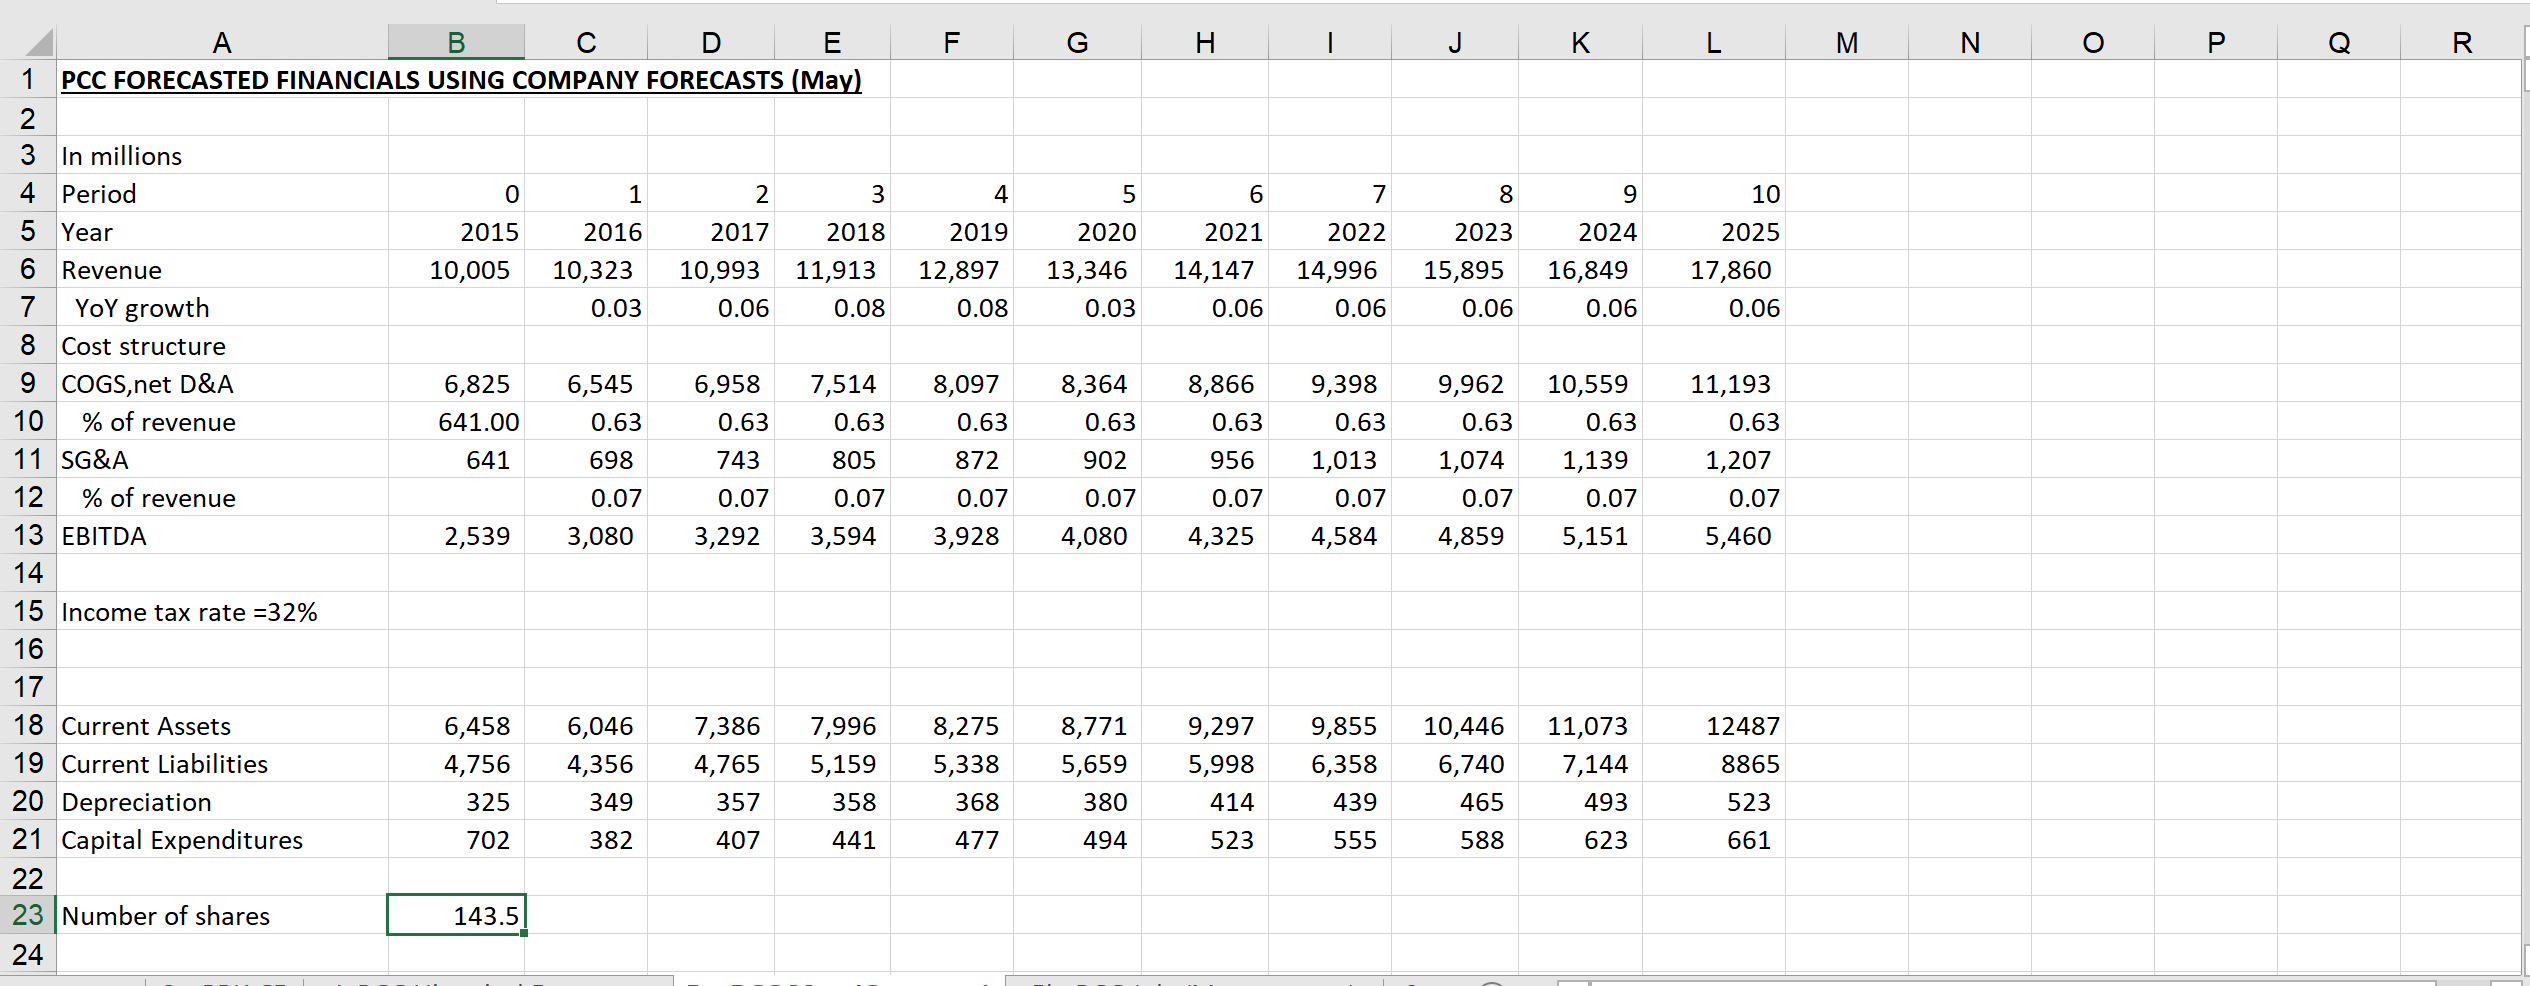
A B C D E F G H I J K L M N PCC FORECASTED FINANCIALS USING COMPANY FORECASTS (May) O P Q R N - 3 In millions 4 Period 0 3 4 5 6 7 8 9 5 Year 10 2015 2016 2017 2018 2019 2020 2021 2022 2023 5 Revenue 2024 2025 10,005 10,323 10,993 11,913 12,897 13,346 14,147 14,996 15,895 16,849 YoY growth 17,860 0.03 0.06 0.08 0.08 0.03 0.06 0.06 0.06 0.06 Cost structure 0.06 COGS,net D&A 6,825 6,545 6,958 7,514 8,097 8,364 8,866 9,398 9,962 10 10,559 11,193 % of revenue 641.00 0.63 0.63 0.63 0.63 0.63 0.63 0.63 0.63 11 SG&A 0.63 0.63 641 698 743 805 872 902 956 1,013 1,074 12 1,139 1,207 % of revenue 0.07 0.07 0.07 0.07 0.07 0.07 0.07 0.07 0.07 13 EBITDA 0.07 2,539 3,080 3,292 3,594 3,928 4,080 4,325 4,584 14 4,859 5,151 5,460 15 Income tax rate =32% 16 17 18 Current Assets 6,458 6,046 7,386 7,996 8,275 8,771 9,297 9,855 10,446 11,073 12487 19 Current Liabilities 4,756 4,356 4,765 5,159 5,338 5,659 5,998 6,358 6,740 7,144 8865 20 Depreciation 325 349 357 358 368 380 414 439 465 493 523 21 Capital Expenditures 702 382 407 441 477 494 523 555 588 22 623 661 23 Number of shares 143.5 24