

Question: A B C D E F G H I J K L A. MSCI Europe B. MSCI Emerging 0.77 Markets 1.00 0.77 0.95 0.97
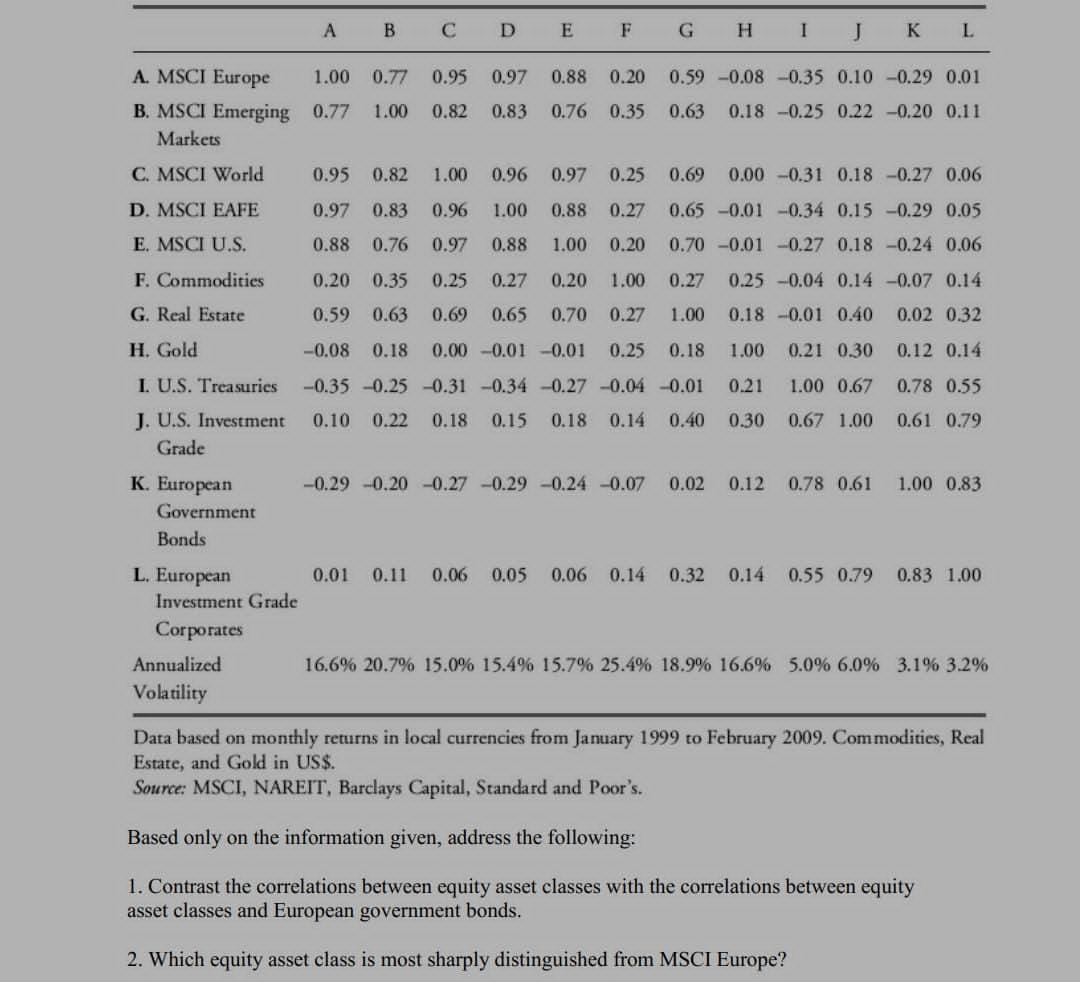
A B C D E F G H I J K L A. MSCI Europe B. MSCI Emerging 0.77 Markets 1.00 0.77 0.95 0.97 1.00 0.82 0.83 0.88 0.20 0.76 0.35 0.59 -0.08 -0.35 0.10 -0.29 0.01 0.63 0.18 -0.25 0.22 -0.20 0.11 C. MSCI World D. MSCI EAFE E. MSCI U.S. F. Commodities G. Real Estate H. Gold 0.95 0.82 1.00 0.96 0.97 0.25 0.97 0.83 0.96 1.00 0.88 0.27 0.88 0.76 0.97 0.88 1.00 0.20 0.20 0.35 0.25 0.27 0.20 1.00 0.59 0.63 0.69 0.65 0.70 0.27 0.25 -0.04 0.14 -0.07 0.14 0.18 -0.01 0.40 0.02 0.32 1.00 0.21 0.30 0.12 0.14 I. U.S. Treasuries J. U.S. Investment Grade K. European Government Bonds L. European Investment Grade Corporates 0.69 0.00 -0.31 0.18 -0.27 0.06 0.65 -0.01 -0.34 0.15 -0.29 0.05 0.70 -0.01 -0.27 0.18 -0.24 0.06 0.27 1.00 -0.08 0.18 0.00 -0.01 -0.01 0.25 0.18 -0.35 -0.25 -0.31 -0.34 -0.27 -0.04 -0.01 0.21 1.00 0.67 0.78 0.55 0.10 0.22 0.18 0.15 0.18 0.14 0.40 0.30 0.67 1.00 0.61 0.79 -0.29 -0.20 -0.27 -0.29 -0.24 -0.07 0.02 0.12 0.78 0.61 1.00 0.83 0.01 0.11 0.06 0.05 0.06 0.14 0.32 0.14 0.55 0.79 0.83 1.00 Annualized Volatility 16.6% 20.7% 15.0% 15.4% 15.7% 25.4% 18.9% 16.6 % 5.0 % 6.0 % 3.1% 3.2% Data based on monthly returns in local currencies from January 1999 to February 2009. Commodities, Real Estate, and Gold in US$. Source: MSCI, NAREIT, Barclays Capital, Standard and Poor's. Based only on the information given, address the following: 1. Contrast the correlations between equity asset classes with the correlations between equity asset classes and European government bonds. 2. Which equity asset class is most sharply distinguished from MSCI Europe?
Step by Step Solution
There are 3 Steps involved in it

Get step-by-step solutions from verified subject matter experts