

Question: A B C D E F G H | J K L M N SUMMARY OUTPUT 1 Write down your forecasting equation for this
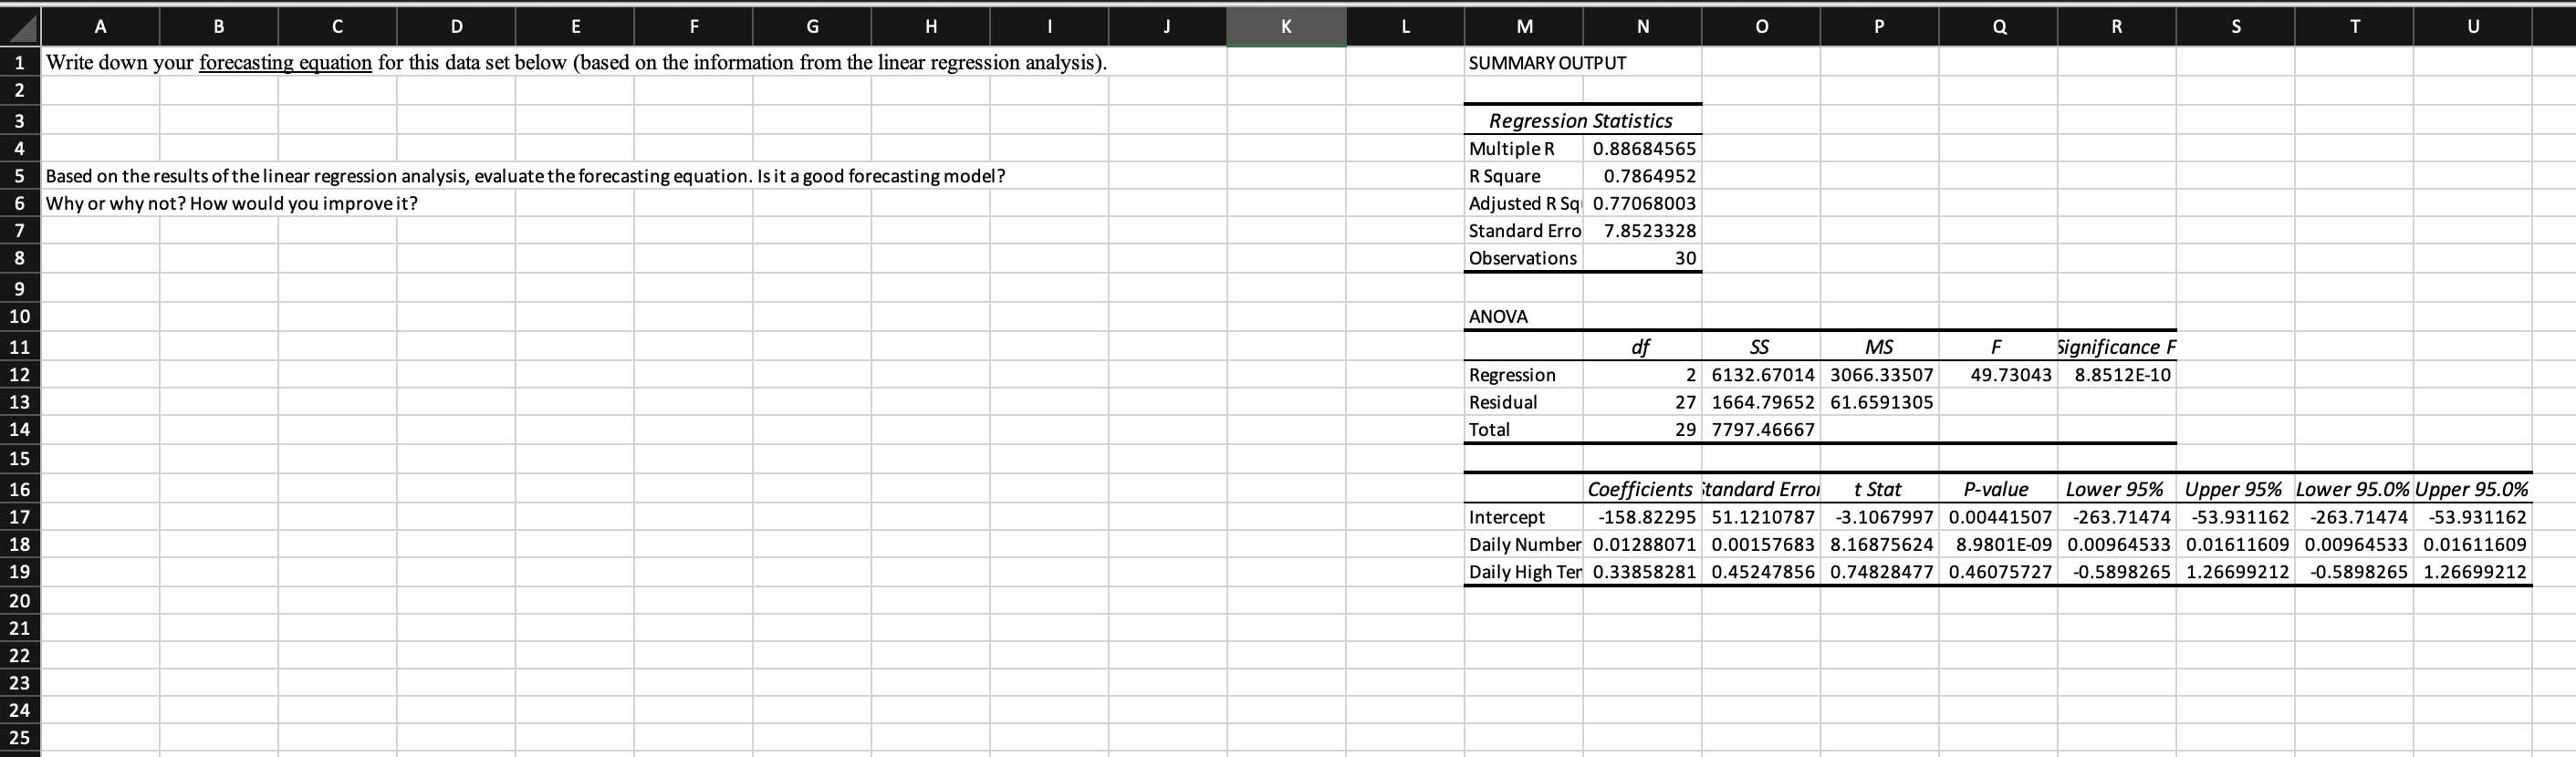
A B C D E F G H | J K L M N SUMMARY OUTPUT 1 Write down your forecasting equation for this data set below (based on the information from the linear regression analysis). 2 3 4 5 Based on the results of the linear regression analysis, evaluate the forecasting equation. Is it a good forecasting model? 6 Why or why not? How would you improve it? 7 8 9 10 11 12 13 14 15 16 17 18 19 20 21 22 23 24 25 Regression Statistics Multiple R R Square 0.88684565 0.7864952 Adjusted R Sq 0.77068003 Standard Erro 7.8523328 Observations 30 ANOVA P 0 R S T U df SS MS F Regression Residual Total 2 6132.67014 3066.33507 27 1664.79652 61.6591305 29 7797.46667 49.73043 Significance F 8.8512E-10 Intercept t Stat P-value -3.1067997 0.00441507 Coefficients tandard Erro Lower 95% Upper 95% Lower 95.0% Upper 95.0% -158.82295 51.1210787 -263.71474 -53.931162 -263.71474 -53.931162 Daily Number 0.01288071 0.00157683 8.16875624 8.9801E-09 0.00964533 0.01611609 0.00964533 0.01611609 Daily High Ter 0.33858281 0.45247856 0.74828477 0.46075727 -0.5898265 1.26699212 -0.5898265 1.26699212
Step by Step Solution
There are 3 Steps involved in it

Get step-by-step solutions from verified subject matter experts