

Question: A B C D E F G H | J K L M N 123453 7 8 2 (In $1,000s) Number of US Adults
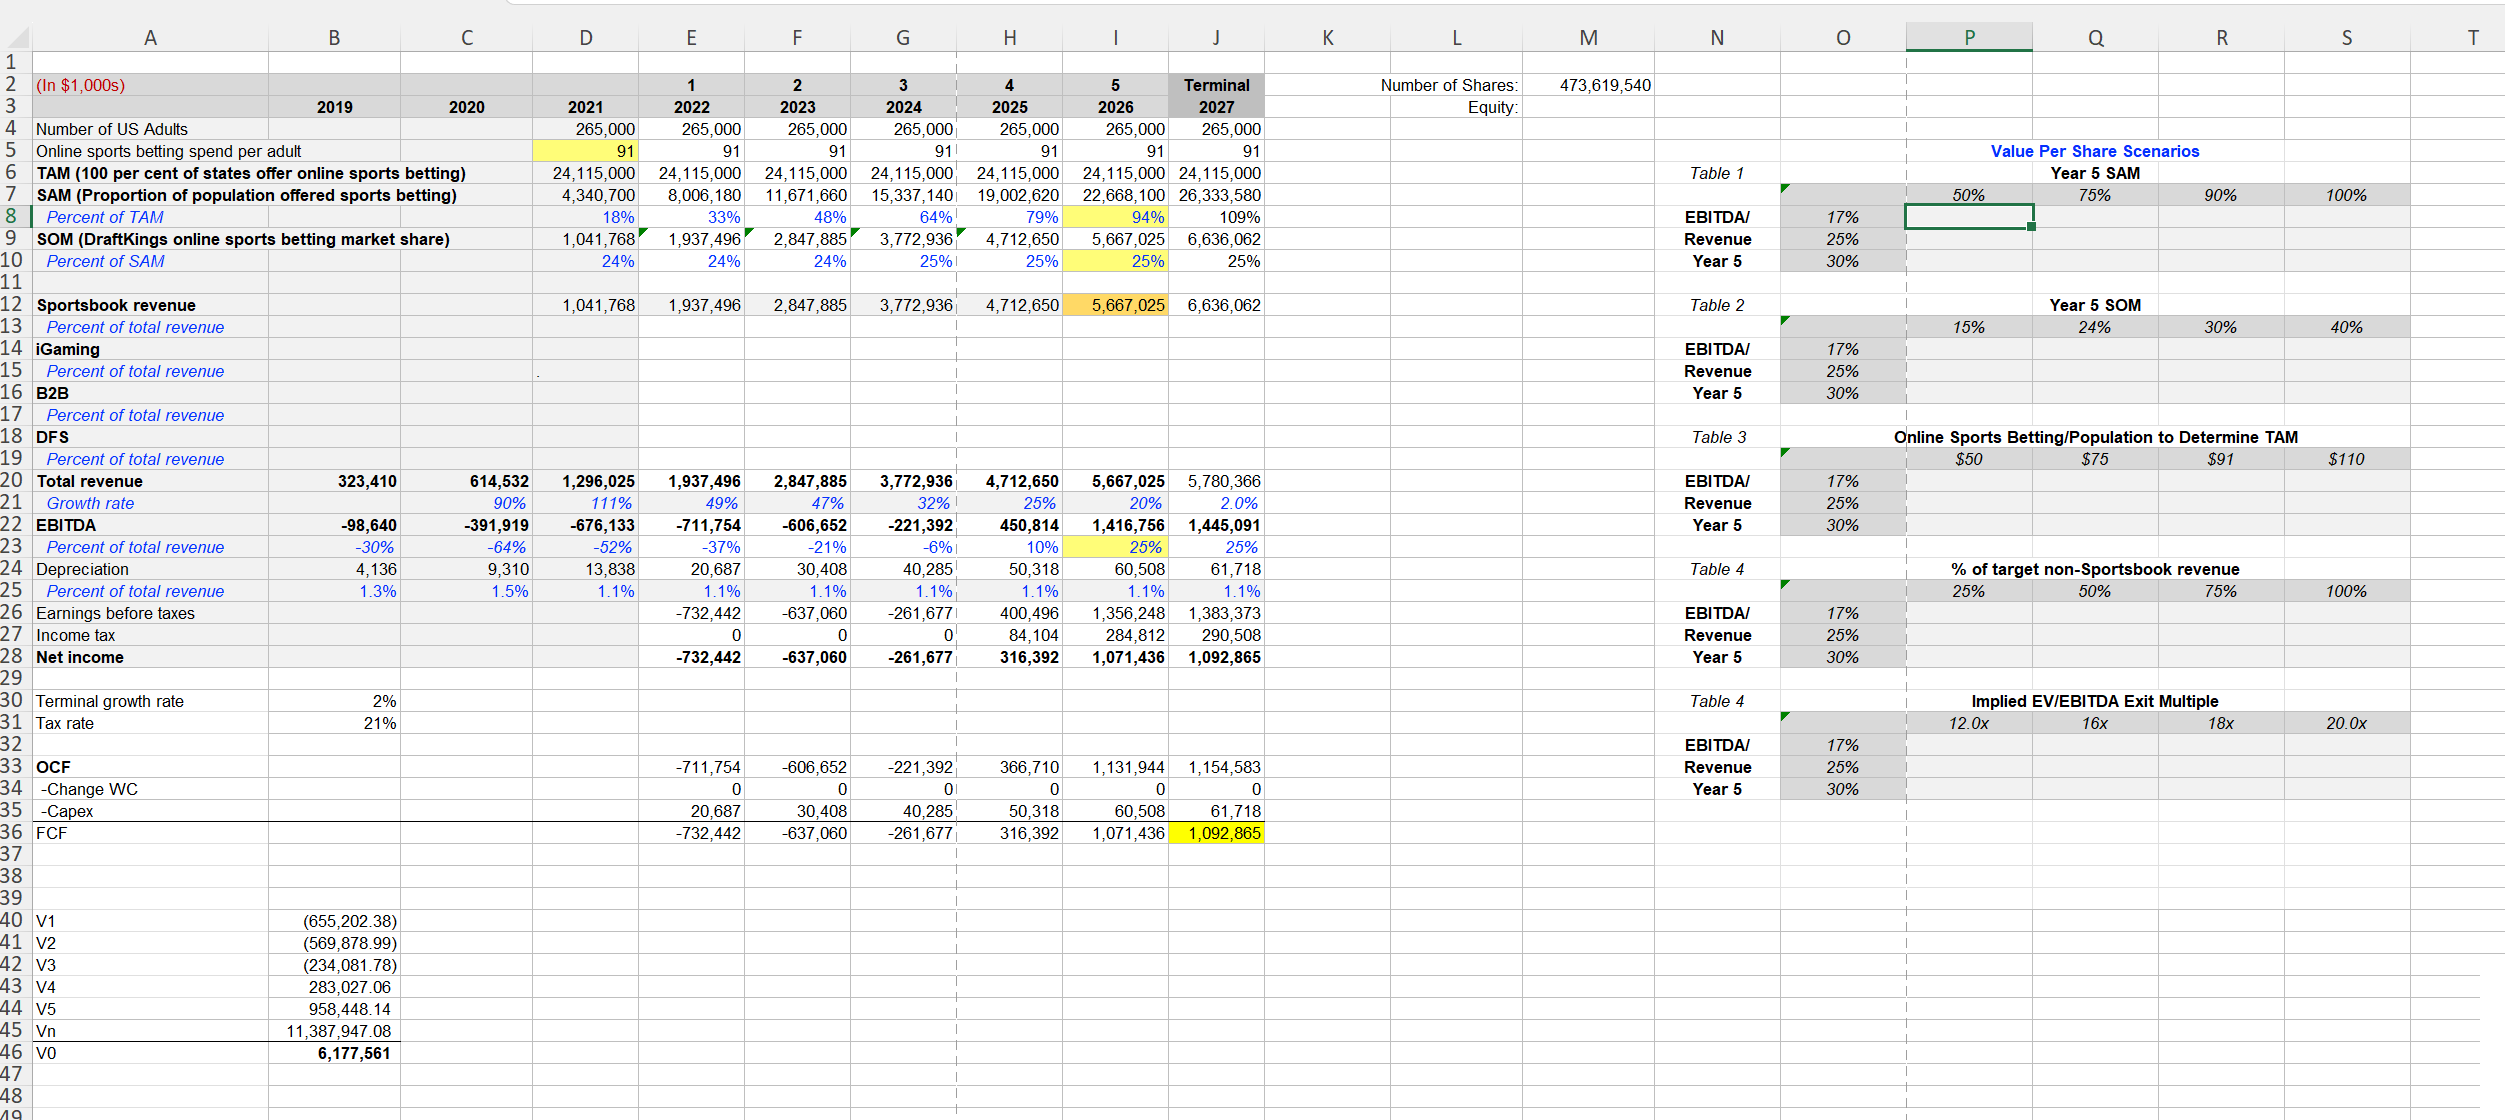
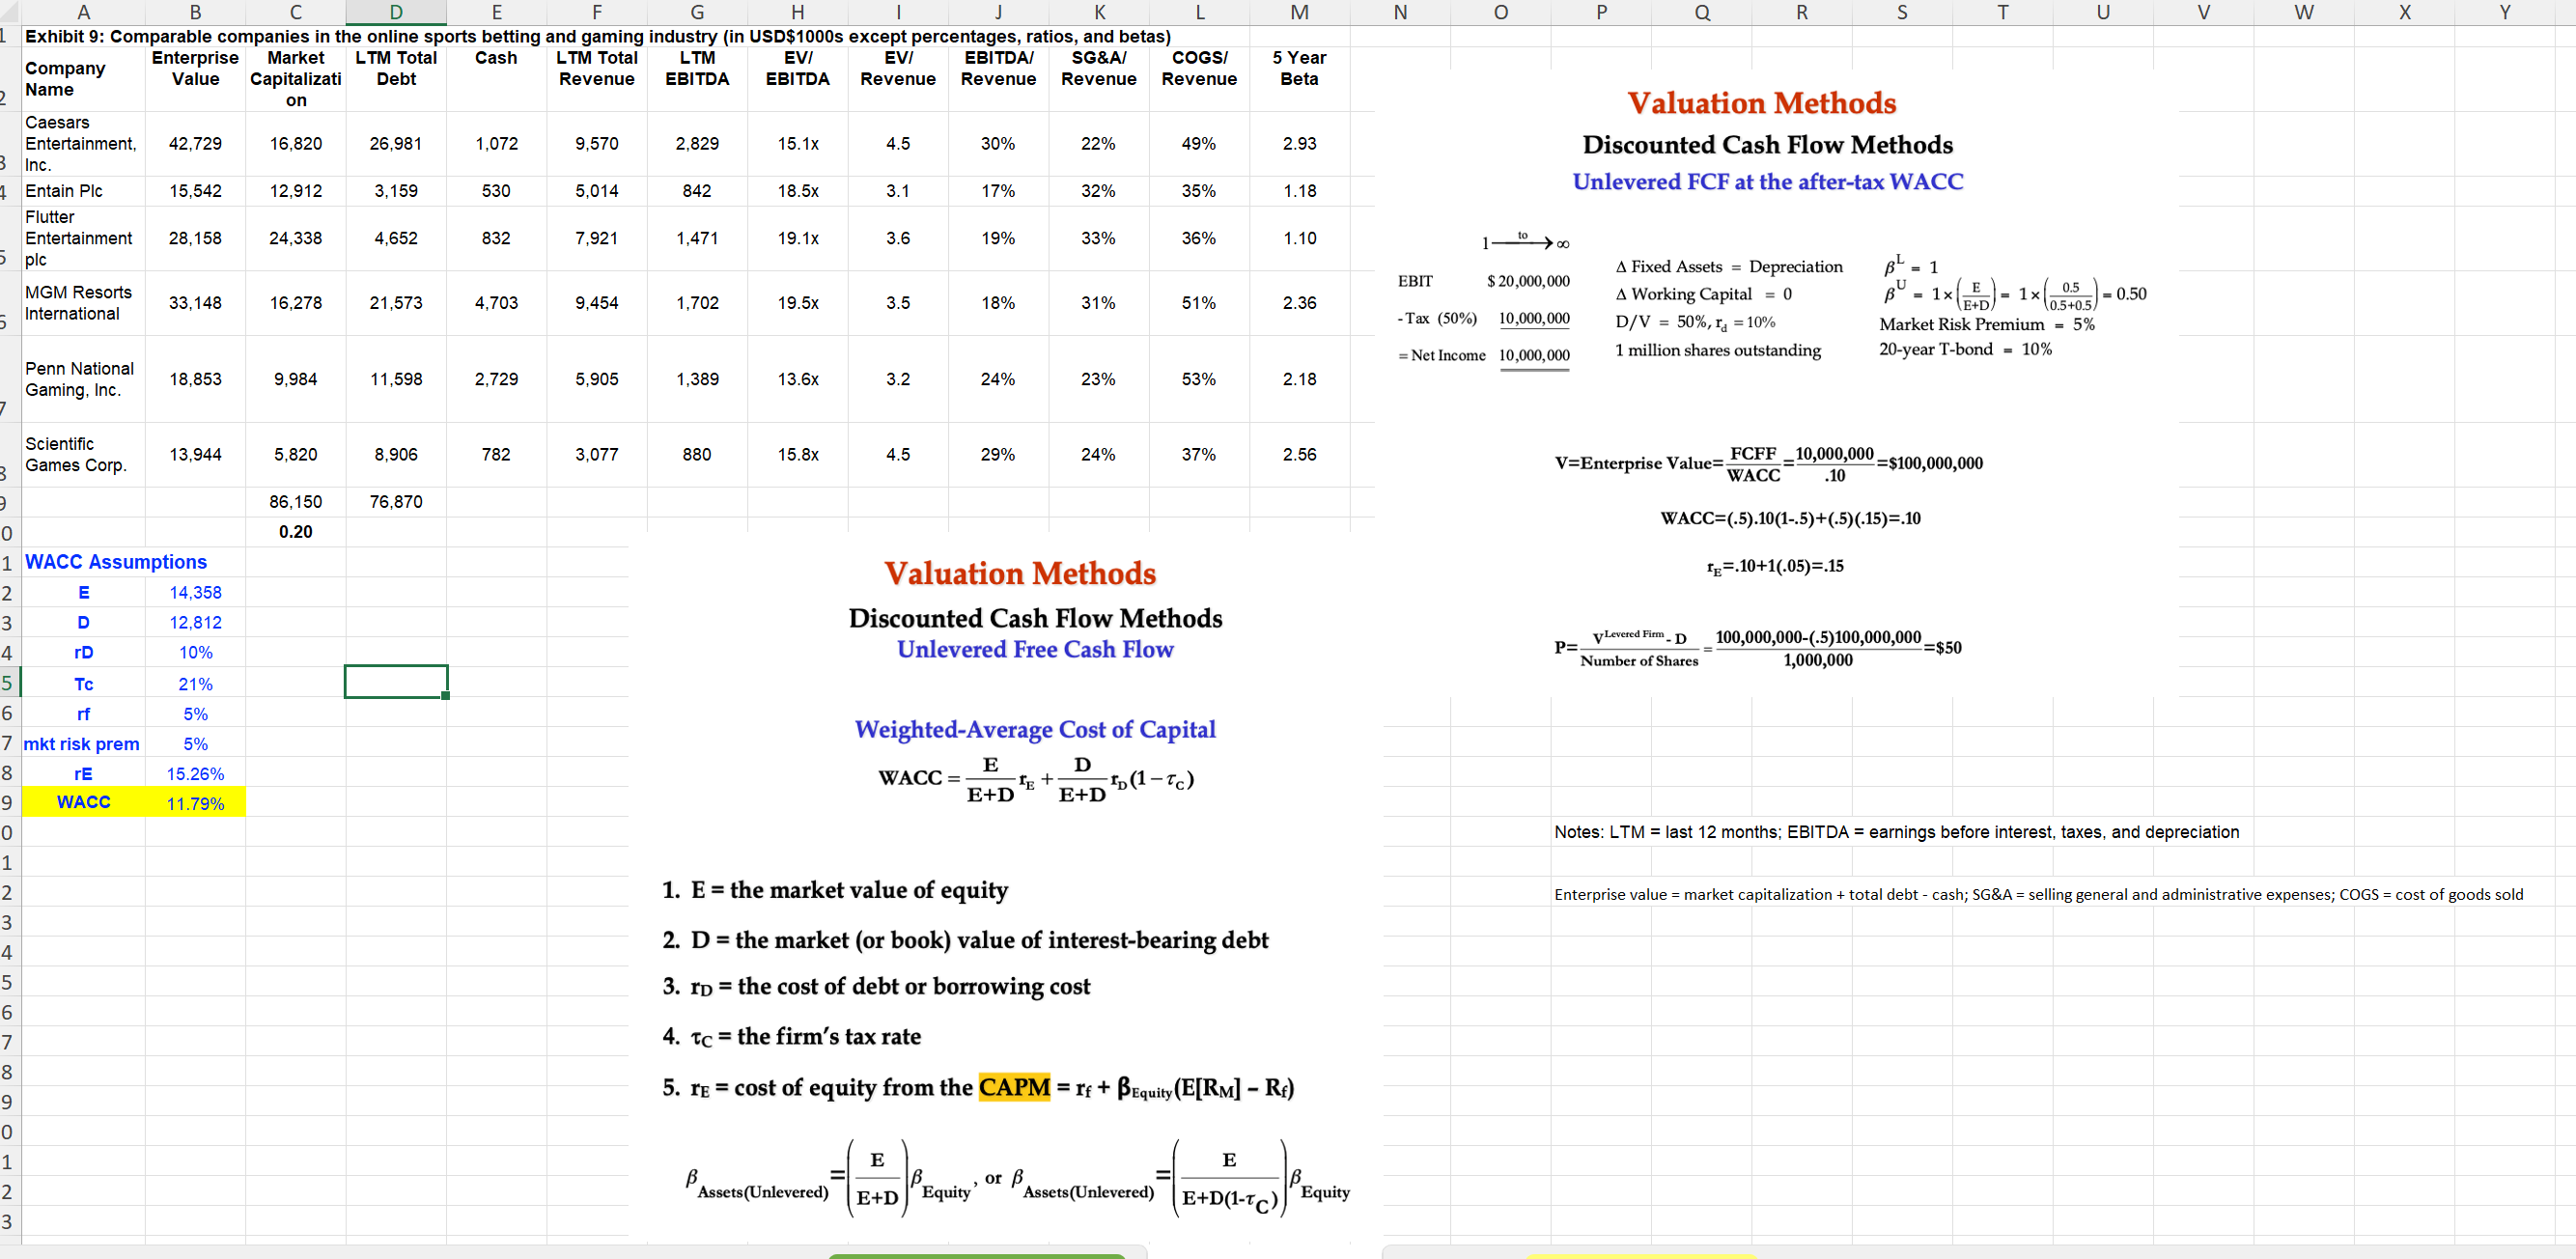
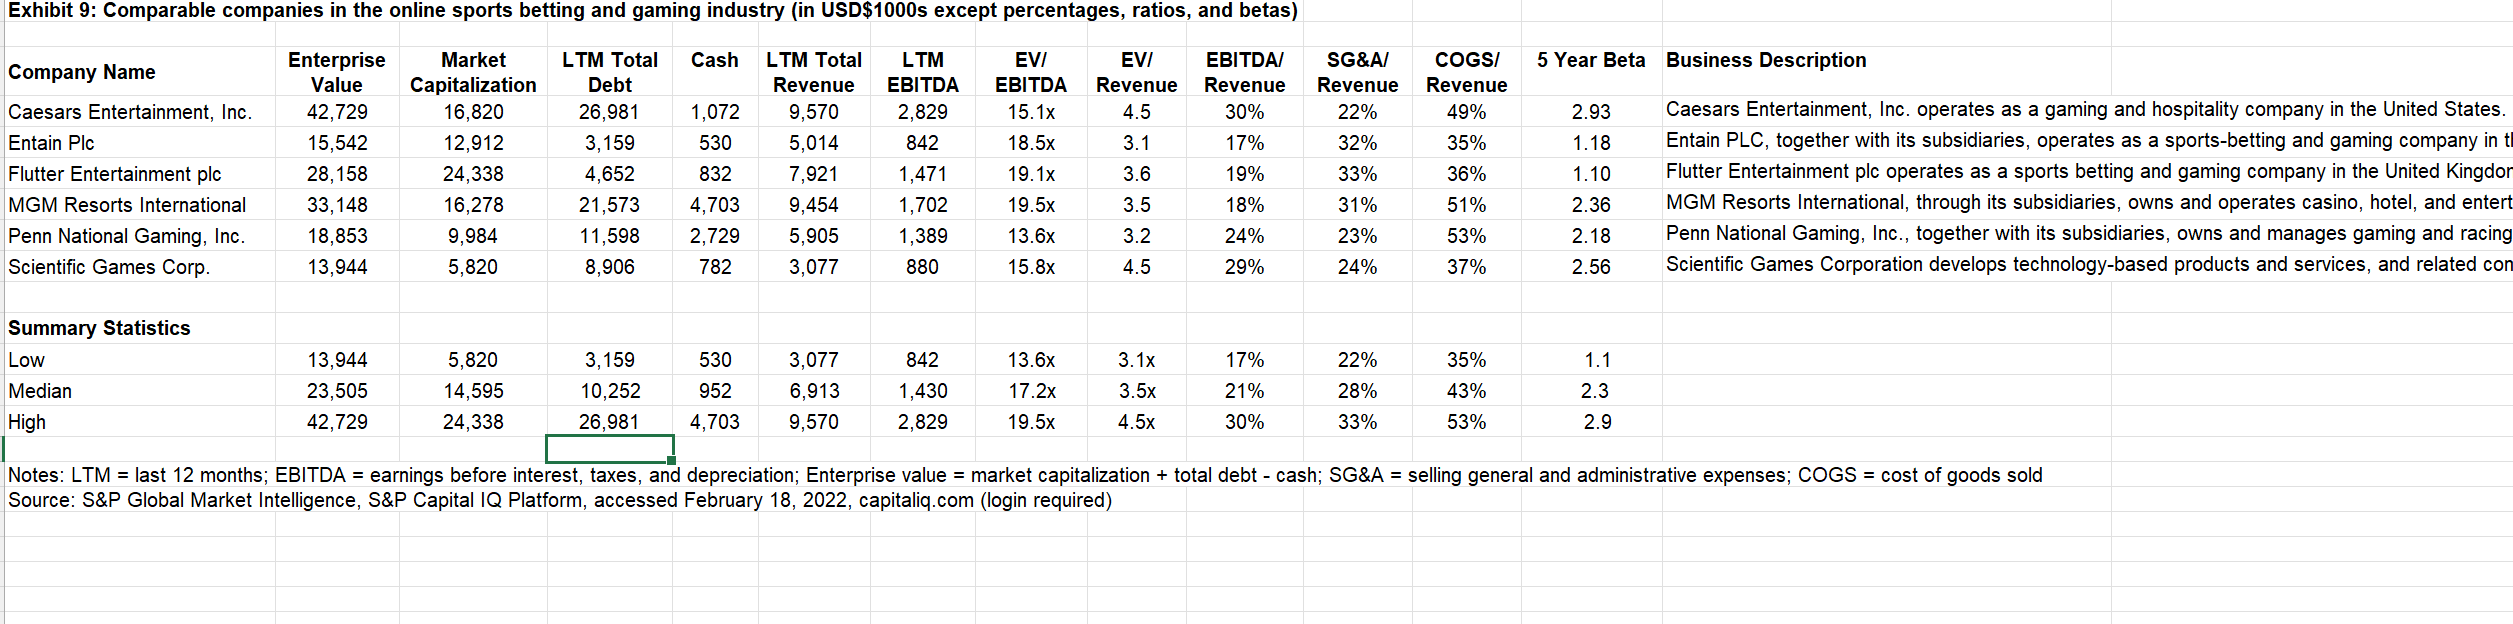
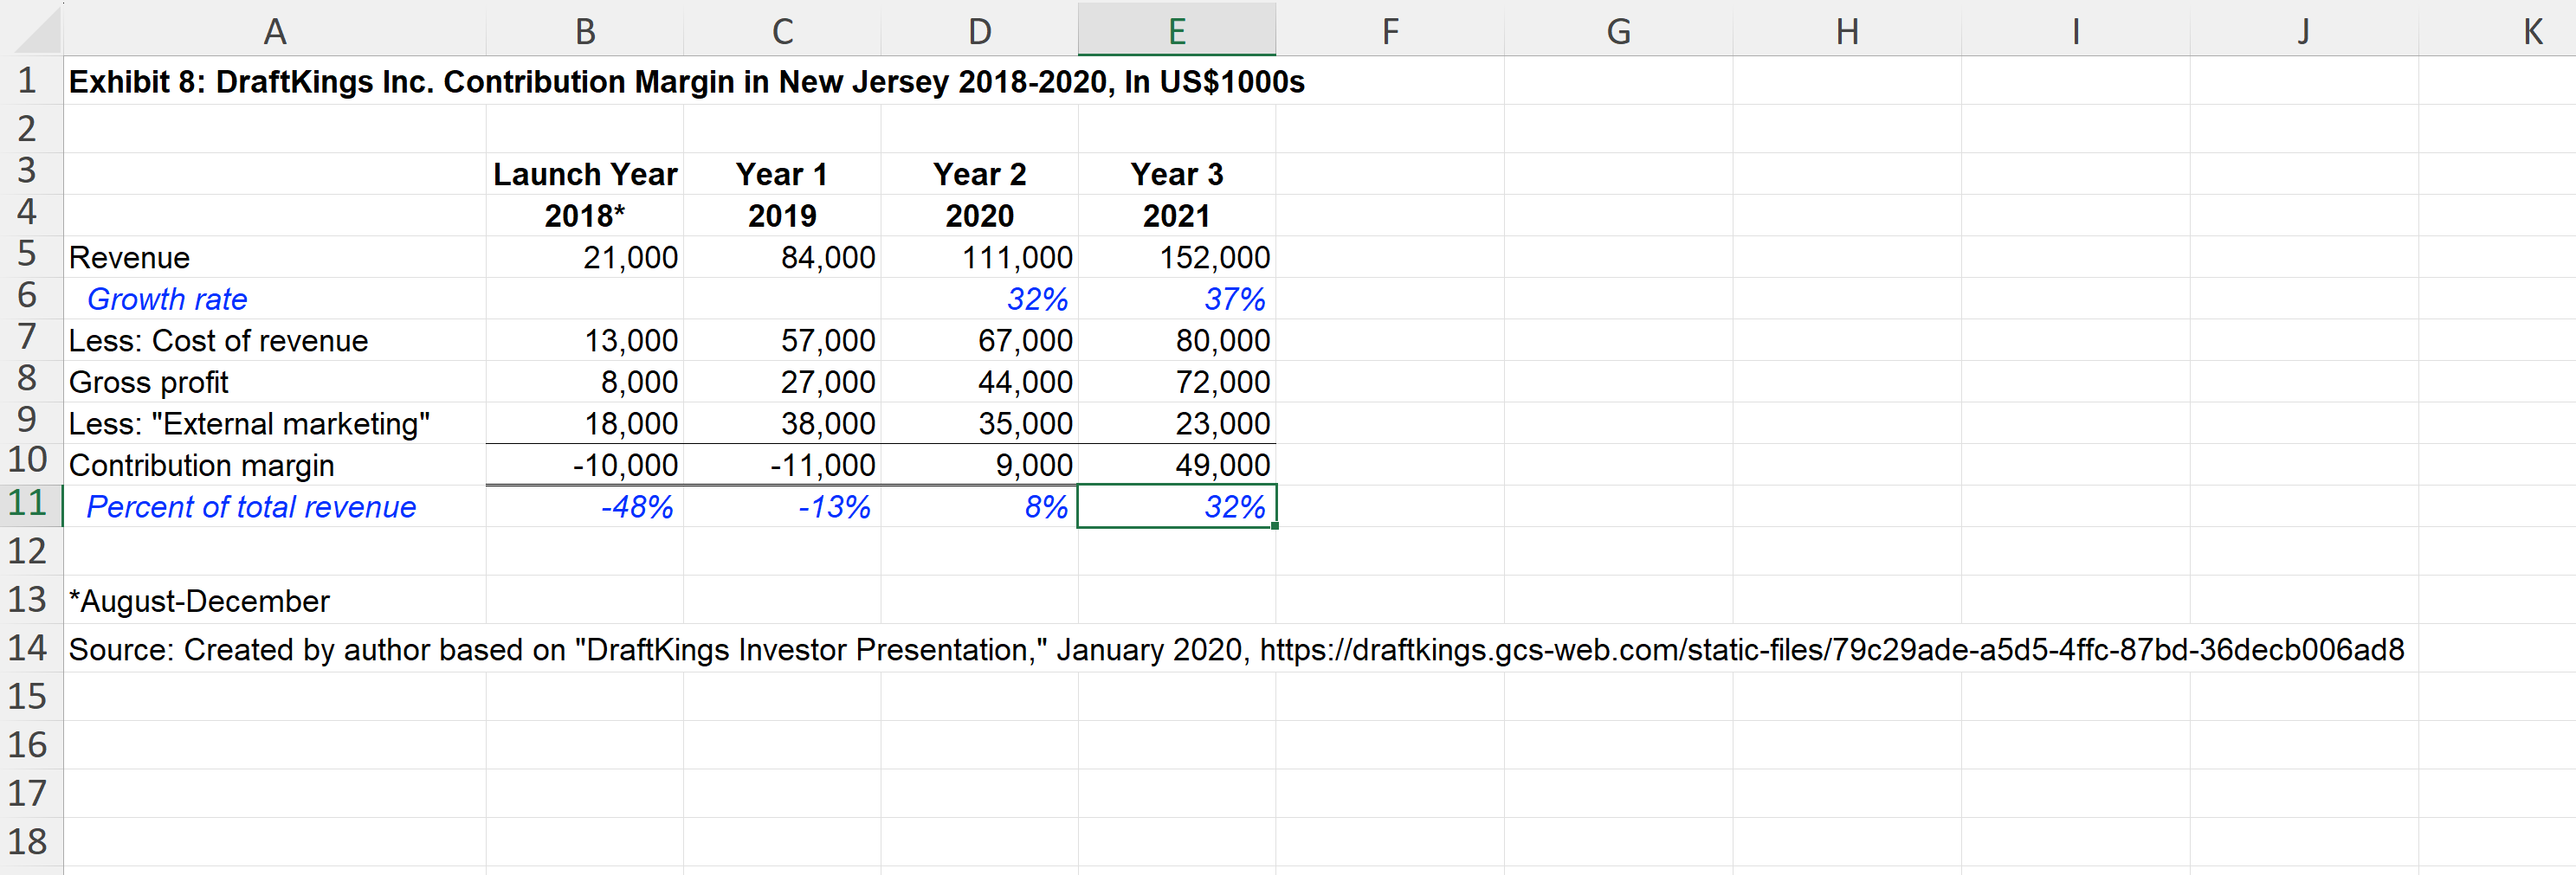
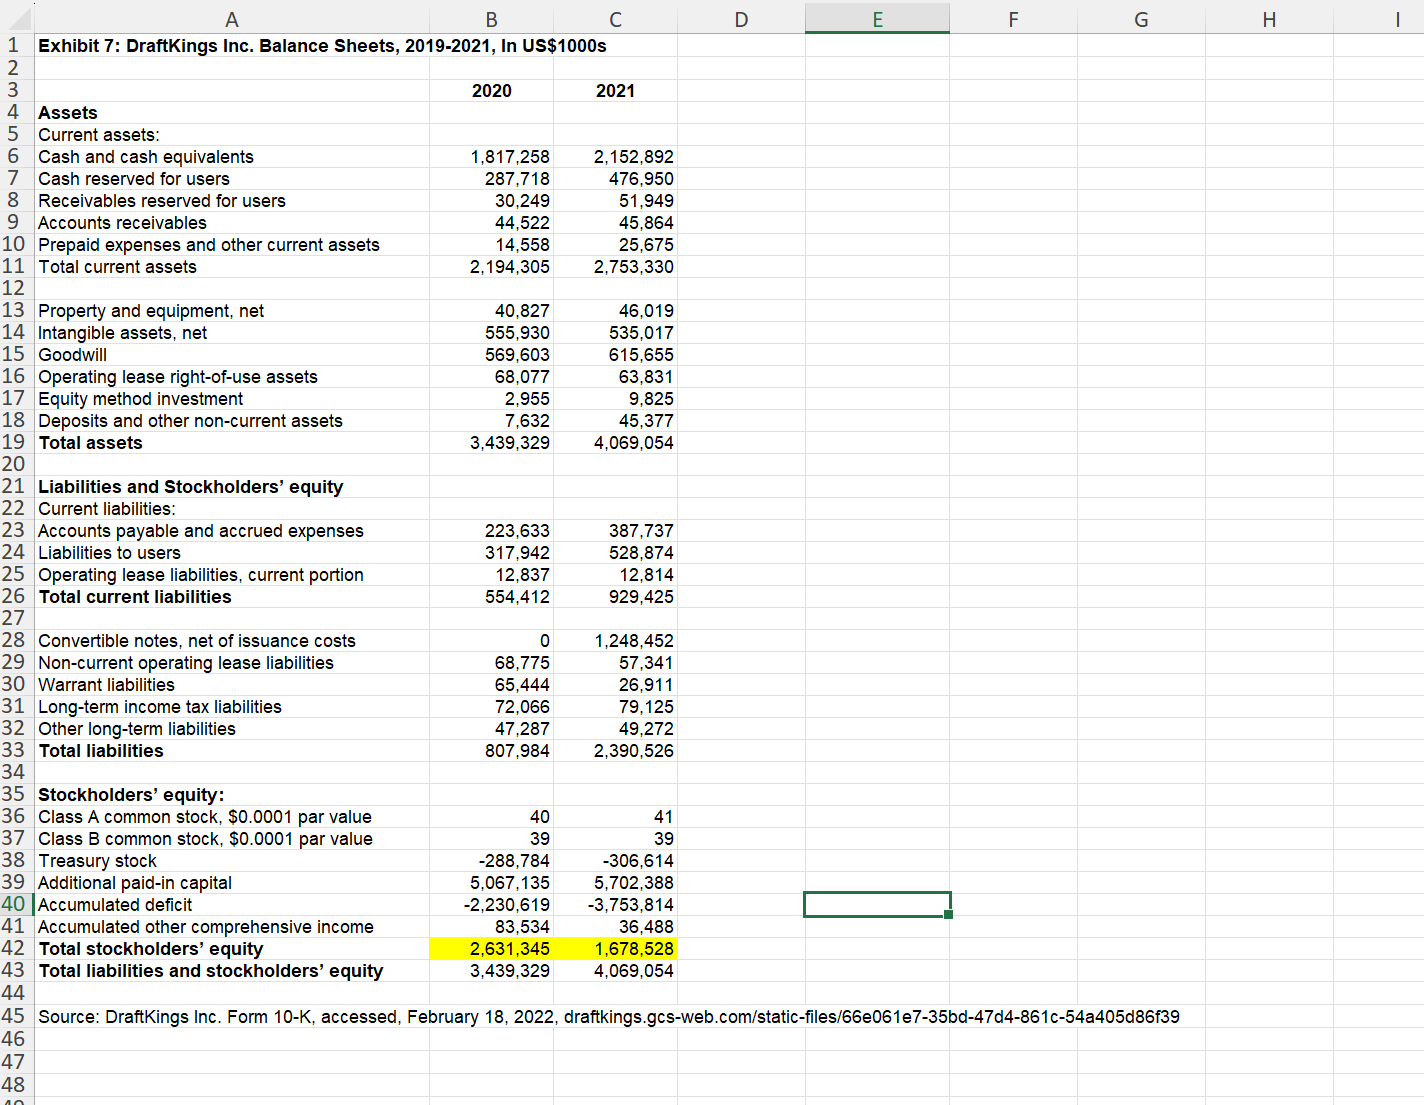
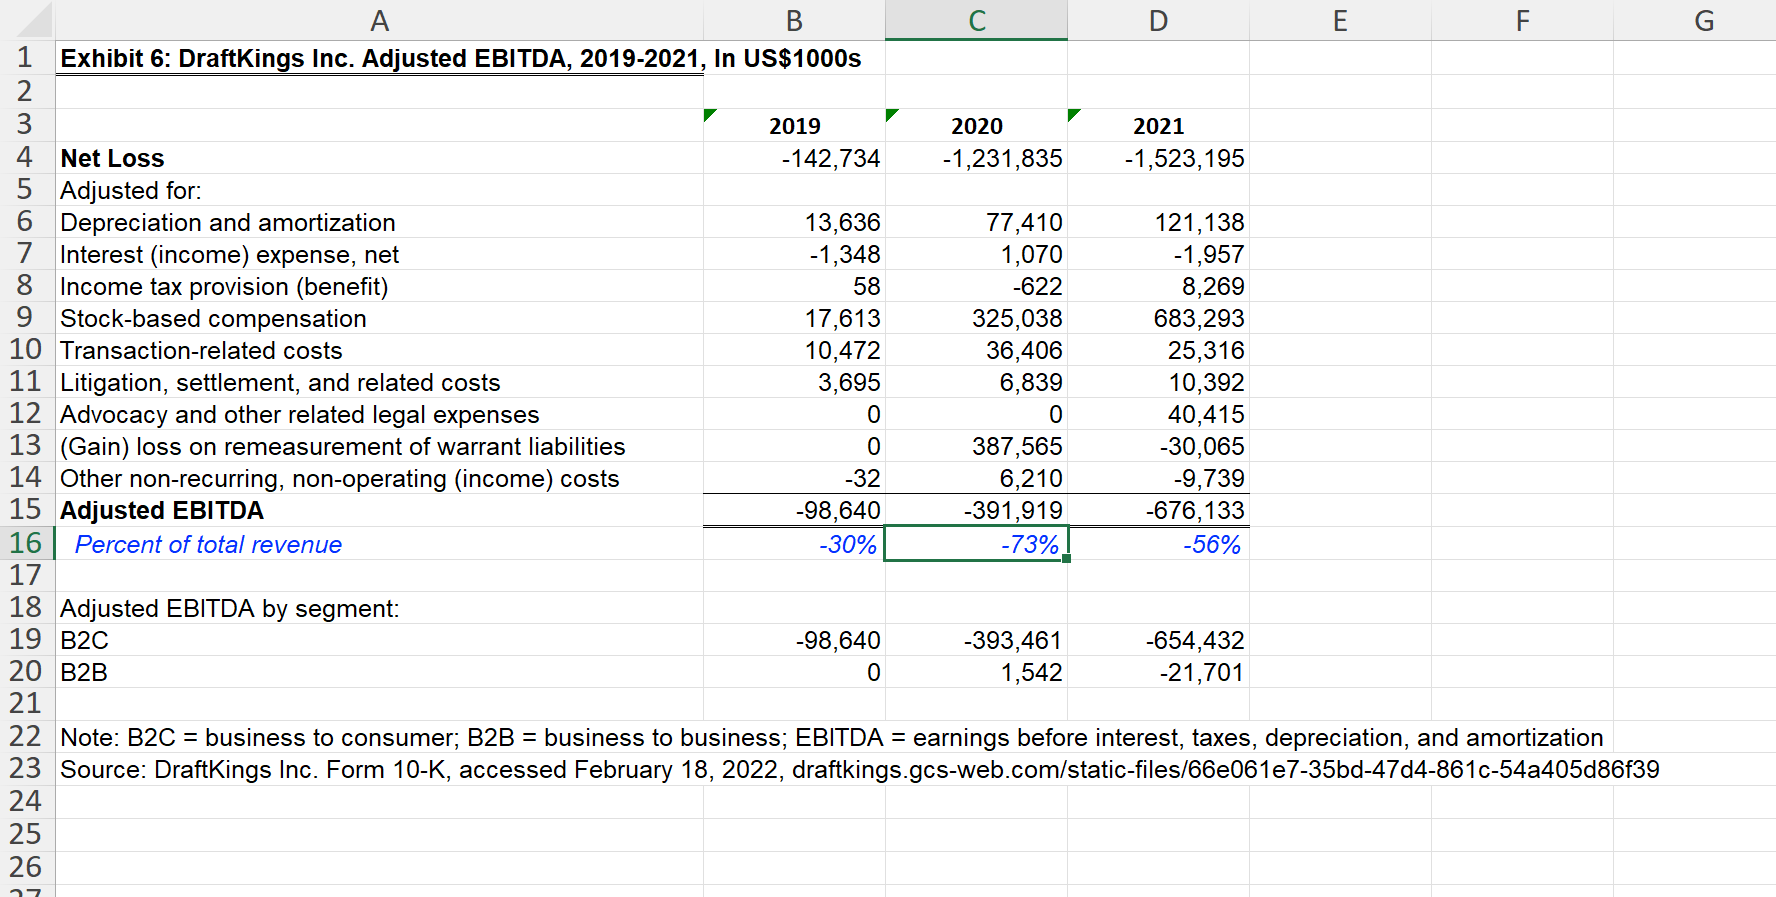
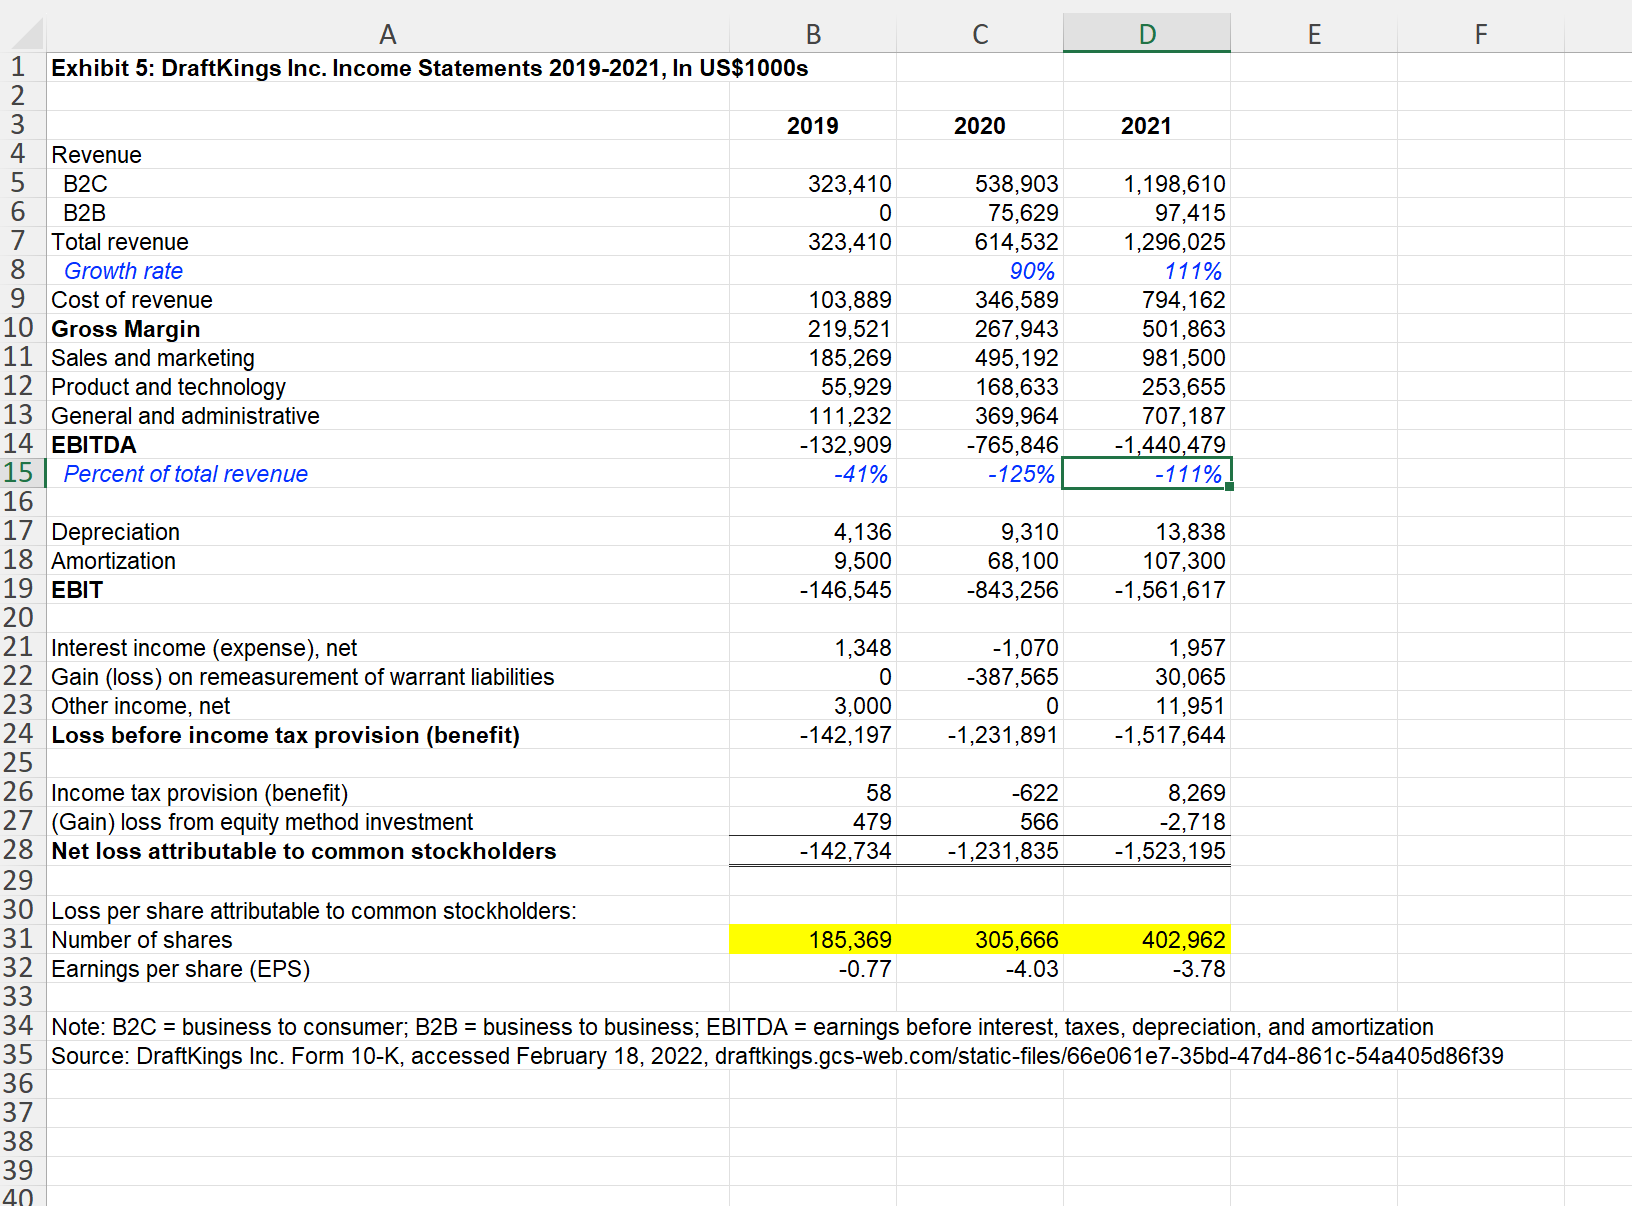
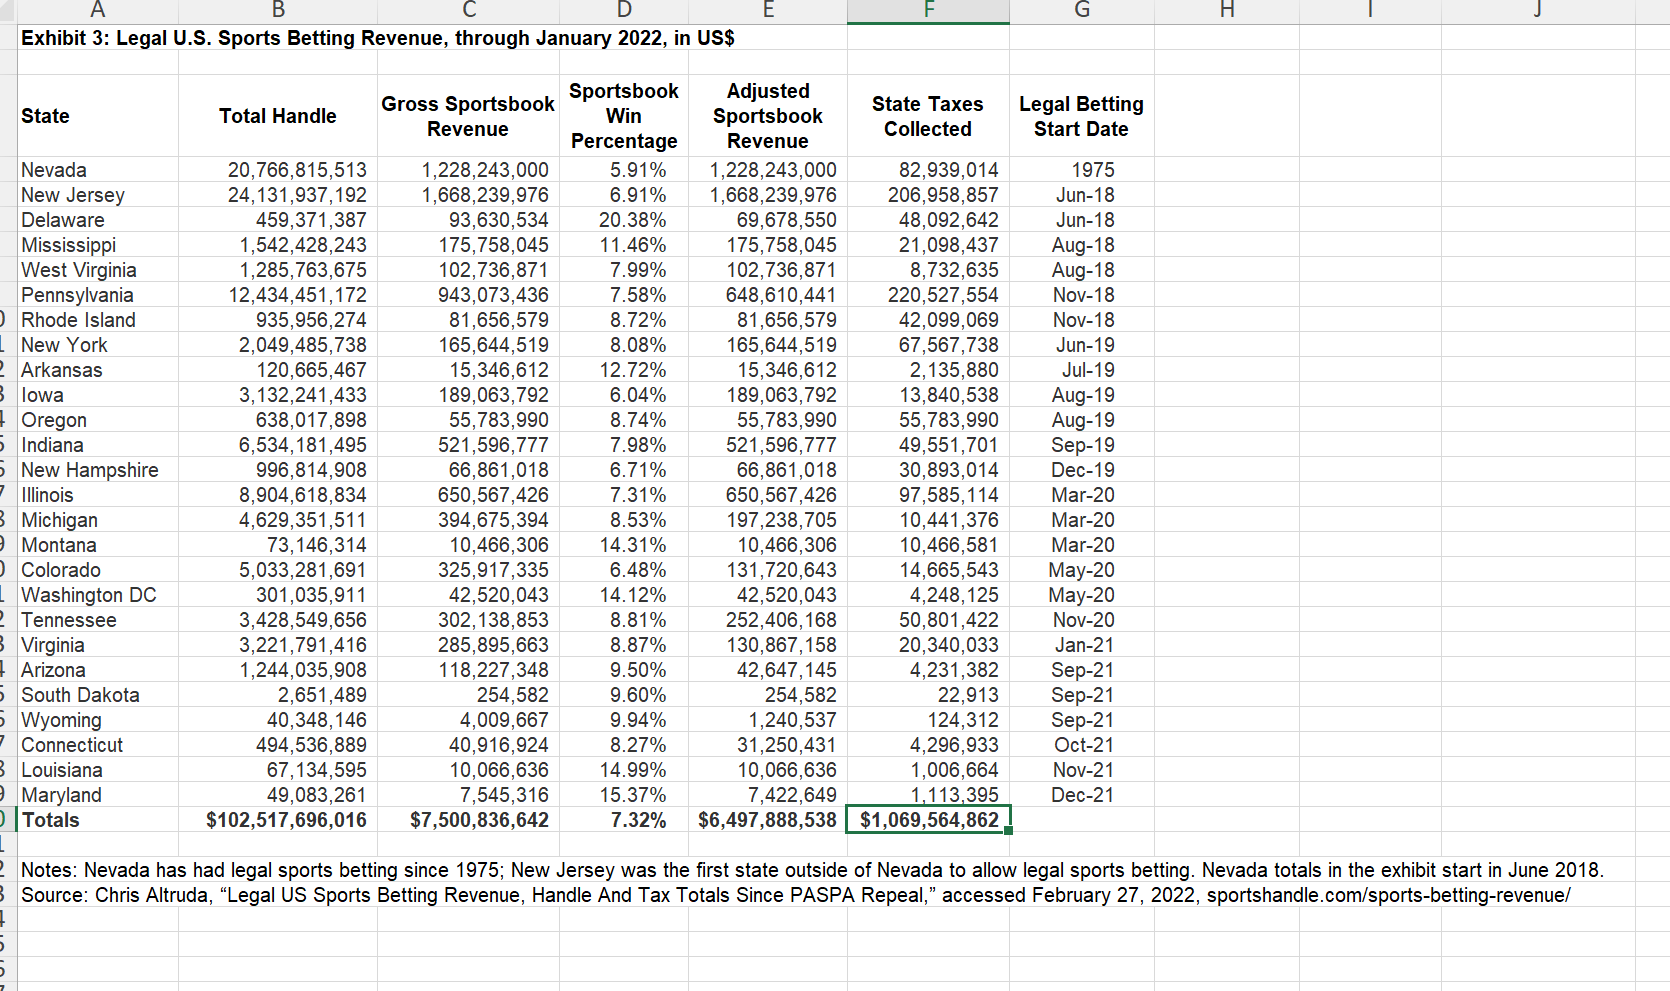
A B C D E F G H | J K L M N 123453 7 8 2 (In $1,000s) Number of US Adults Online sports betting spend per adult 6 TAM (100 per cent of states offer online sports betting) Percent of TAM 1 2 3 4 5 Terminal 2019 2020 2021 2022 2023 2024 265,000 91 265,000 91 265,000 91 265,000 91 2025 265,000 91 2026 2027 Number of Shares: Equity: 473,619,540 265,000 265,000 91 91 24,115,000 24,115,000 SAM (Proportion of population offered sports betting) 9 10 SOM (DraftKings online sports betting market share) Percent of SAM 1,041,768 24% 4,340,700 8,006,180 18% 33% 1,937,496 24% 24,115,000 24,115,000 11,671,660 48% 2,847,885 24% 15,337,140 64% 3,772,936 25% 24,115,000 19,002,620 79% 4,712,650 25% 24,115,000 24,115,000 22,668,100 26,333,580 94% 109% 5,667,025 6,636,062 25% 25% Table 1 11 12 Sportsbook revenue 1,041,768 1,937,496 2,847,885 3,772,936 4,712,650 5,667,025 6,636,062 0 P Q R S Value Per Share Scenarios Year 5 SAM 50% 75% 90% 100% EBITDA/ Revenue 17% 25% Year 5 30% Table 2 13 Percent of total revenue 15% Year 5 SOM 24% 30% 40% 16 14 iGaming 15 Percent of total revenue B2B 17 Percent of total revenue 18 DFS EBITDA/ 17% Revenue Year 5 25% 30% Table 3 19 Percent of total revenue Online Sports Betting/Population to Determine TAM $50 $75 $91 $110 20 Total revenue 323,410 21 Growth rate 22 EBITDA -98,640 614,532 90% -391,919 23 Percent of total revenue -30% 24 Depreciation 4,136 -64% 9,310 1,296,025 111% -676,133 -52% 13,838 25 Percent of total revenue 1.3% 1.5% 1.1% 26 Earnings before taxes 1,937,496 49% -711,754 -37% 20,687 1.1% -732,442 2,847,885 47% -606,652 -21% 30,408 1.1% -637,060 3,772,936 32% -221,392 -6% 40,285 1.1% -261,677 4,712,650 25% 450,814 10% 50,318 5,667,025 20% 1,416,756 25% 60,508 5,780,366 EBITDA/ 17% 2.0% Revenue 25% 1,445,091 Year 5 30% 25% 61,718 Table 4 27 Income tax 0 0 28 Net income -732,442 -637,060 0 -261,677 1.1% 400,496 84,104 316,392 1.1% 1,356,248 284,812 1,071,436 1.1% 1,383,373 290,508 1,092,865 % of target non-Sportsbook revenue 25% 50% 75% 100% EBITDA/ Revenue 17% 25% Year 5 30% 31 Tax rate 32 33 OCF 34 -Change WC 29 30 Terminal growth rate 2% 21% Table 4 12.0x Implied EV/EBITDA Exit Multiple 16x 18x 20.0x EBITDA/ 17% -711,754 0 -606,652 0 -221,392 0 366,710 0 1,131,944 1,154,583 Revenue 25% 0 Year 5 30% 35 -Capex 20,687 36 FCF -732,442 30,408 -637,060 40,285 -261,677 50,318 316,392 60,508 1,071,436 61,718 1,092,865 37 38 39 40 V1 (655,202.38) 41 V2 (569,878.99) 42 V3 (234,081.78) 43 V4 283,027.06 44 V5 45 Vn 46 vo 958,448.14 11,387,947.08 6,177,561 47 48 19 T L COGS/ Revenue 5 Year Beta A B D E F G H K 1 Exhibit 9: Comparable companies in the online sports betting and gaming industry (in USD$1000s except percentages, ratios, and betas) Enterprise Market LTM Total Cash Company Value Capitalizati on Debt LTM Total Revenue LTM EBITDA EV/ EVI EBITDA Revenue J EBITDA/ SG&A/ Revenue Revenue N 0 P Q R S T U V W X Y Name 2 Caesars Entertainment, 42,729 16,820 26,981 1,072 9,570 2,829 15.1x 4.5 30% 22% 49% 2.93 3. Inc. Valuation Methods Discounted Cash Flow Methods Unlevered FCF at the after-tax WACC 1 Entain Plc 15,542 12,912 3,159 530 5.014 842 18.5x 3.1 17% 32% 35% 1.18 Flutter Entertainment 28,158 24,338 4,652 832 7,921 1,471 19.1x 3.6 19% 33% 36% 1.10 1 5 plc A Fixed Assets = Depreciation EBIT $20,000,000 MGM Resorts A Working Capital = 0 BL = BU = = 1 33,148 16,278 21,573 4,703 9,454 1,702 19.5x 3.5 18% 31% 51% 2.36 = 1x (E). = 1x 0.5 0.5+0.5/ = 0.50 International 5 -Tax (50%) 10,000,000 D/V = 50%, r = 10% Net Income 10,000,000 1 million shares outstanding Market Risk Premium = 5% 20-year T-bond = 10% Penn National 18,853 9,984 11,598 2,729 5,905 1,389 13.6x 3.2 24% 23% 53% 2.18 Gaming, Inc. 7 Scientific 13.944 5,820 8,906 782 3,077 880 15.8x 4.5 29% 24% 37% 2.56 3. Games Corp. 9 86,150 76,870 0123 1 WACC Assumptions E 14,358 D 12,812 4 rD 10% 5 Tc 21% 67 rf 5% 7 mkt risk prem 5% 0.20 Valuation Methods Discounted Cash Flow Methods Unlevered Free Cash Flow V=Enterprise Value=; FCFF _ 10,000,000 WACC =$100,000,000 .10 VLevered Firm-D P= Number of Shares 100,000,000-(.5)100,000,000. 1,000,000 =$50 WACC=(.5).10(1-.5)+(.5)(.15)=.10 TE=.10+1(.05)=.15 Weighted-Average Cost of Capital WACC = E E+D D E+D IE + TD (1-T) 8 rE 15.26% 9 WACC 11.79% 0 1 2 3 4 5 6 7 866723 9 0 1 Notes: LTM = last 12 months; EBITDA = earnings before interest, taxes, and depreciation 1. E the market value of equity 2. D = the market (or book) value of interest-bearing debt 3. rD = the cost of debt or borrowing cost 4. tc = the firm's tax rate 5. re = cost of equity from the CAPM = rf + Equity (E[RM] - Rf) Enterprise value = market capitalization + total debt - cash; SG&A = selling general and administrative expenses; COGS = cost of goods sold E Assets (Unlevered) E+D Equity E ' or B Assets (Unlevered) E+D(1-T Equity Exhibit 9: Comparable companies in the online sports betting and gaming industry (in USD$1000s except percentages, ratios, and betas) 5 Year Beta Business Description Caesars Entertainment, Inc. operates as a gaming and hospitality company in the United States. Entain PLC, together with its subsidiaries, operates as a sports-betting and gaming company in t Flutter Entertainment plc operates as a sports betting and gaming company in the United Kingdor MGM Resorts International, through its subsidiaries, owns and operates casino, hotel, and entert Penn National Gaming, Inc., together with its subsidiaries, owns and manages gaming and racing Scientific Games Corporation develops technology-based products and services, and related con Enterprise Market LTM Total Cash LTM Total Company Name Value Capitalization Debt Revenue LTM EBITDA EV/ EVI EBITDA Revenue EBITDA/ Revenue SG&A/ COGS/ Revenue Revenue Caesars Entertainment, Inc. Entain Plc 42,729 16,820 26,981 1,072 9,570 2,829 15.1x 4.5 30% 22% 49% 2.93 15,542 12,912 3,159 530 5,014 842 18.5x 3.1 17% 32% 35% 1.18 Flutter Entertainment plc 28,158 24,338 4,652 832 7,921 1,471 19.1x 3.6 19% 33% 36% 1.10 MGM Resorts International 33,148 16,278 21,573 4,703 9,454 1,702 19.5 3.5 18% 31% 51% 2.36 Penn National Gaming, Inc. 18,853 9,984 11,598 2,729 5,905 1,389 13.6x 3.2 24% 23% 53% Scientific Games Corp. 13,944 5,820 8,906 782 3,077 880 15.8x 4.5 29% 24% 37% 2.18 2.56 Summary Statistics Low Median High 13,944 5,820 3,159 23,505 42,729 14,595 24,338 10,252 26,981 530 952 4,703 3,077 842 13.6x 3.1x 17% 22% 35% 1.1 6,913 9,570 1,430 17.2x 3.5x 21% 28% 43% 2,829 19.5 4.5x 30% 33% 53% 2.3 2.9 Notes: LTM = last 12 months; EBITDA = earnings before interest, taxes, and depreciation; Enterprise value = market capitalization + total debt - cash; SG&A = selling general and administrative expenses; COGS = cost of goods sold Source: S&P Global Market Intelligence, S&P Capital IQ Platform, accessed February 18, 2022, capitaliq.com (login required) A B C D E 1 Exhibit 8: DraftKings Inc. Contribution Margin in New Jersey 2018-2020, In US$1000s 2 3 4 Launch Year Year 1 2018* 2019 Year 2 2020 Year 3 2021 5 Revenue 21,000 84,000 111,000 152,000 6 Growth rate 32% 37% 7 Less: Cost of revenue 13,000 57,000 67,000 80,000 8 Gross profit 8,000 27,000 44,000 72,000 9 Less: "External marketing" 18,000 38.000 35,000 23,000 10 Contribution margin -10,000 -11,000 11 Percent of total revenue -48% -13% 9,000 8% 49,000 32% 12 LL F G H | J K 13 August-December 14 Source: Created by author based on "DraftKings Investor Presentation," January 2020, https://draftkings.gcs-web.com/static-files/79c29ade-a5d5-4ffc-87bd-36decb006ad8 15 16 17 18 A B 1 Exhibit 7: DraftKings Inc. Balance Sheets, 2019-2021, In US$1000s 2 3 4 Assets 5 Current assets: 2020 2021 D E 6 Cash and cash equivalents 1,817,258 2,152,892 7 Cash reserved for users 287,718 476,950 8 Receivables reserved for users 30,249 51,949 9 Accounts receivables 44,522 45,864 10 Prepaid expenses and other current assets 14,558 25,675 11 Total current assets 2,194,305 2,753,330 12 13 Property and equipment, net 14 Intangible assets, net 15 Goodwill 40,827 46,019 555,930 535,017 569,603 615,655 16 Operating lease right-of-use assets 68,077 63,831 17 Equity method investment 2,955 9,825 18 Deposits and other non-current assets 7,632 45,377 19 Total assets 3,439,329 4,069,054 20 21 Liabilities and Stockholders' equity 22 Current liabilities: 23 Accounts payable and accrued expenses 223,633 387,737 24 Liabilities to users 317,942 528,874 25 Operating lease liabilities, current portion 12,837 12,814 26 Total current liabilities 554,412 929,425 27 28 Convertible notes, net of issuance costs 1,248,452 29 Non-current operating lease liabilities 68,775 57.341 30 Warrant liabilities 65,444 26,911 31 Long-term income tax liabilities 72,066 79,125 33 Total liabilities 34 32 Other long-term liabilities 35 Stockholders' equity: 47,287 49,272 807,984 2,390,526 36 Class A common stock, $0.0001 par value 40 41 37 Class B common stock, $0.0001 par value 39 39 38 Treasury stock -288,784 -306,614 39 Additional paid-in capital 5,067,135 5,702,388 40 Accumulated deficit -2,230,619 -3,753,814 41 Accumulated other comprehensive income 83,534 36,488 42 Total stockholders' equity 2,631,345 43 Total liabilities and stockholders' equity 3,439,329 1,678,528 4,069,054 44 FL G 45 Source: DraftKings Inc. Form 10-K, accessed, February 18, 2022, draftkings.gcs-web.com/static-files/66e061e7-35bd-47d4-861c-54a405d86f39 46 47 48 H | 2 A B Exhibit 6: DraftKings Inc. Adjusted EBITDA, 2019-2021, In US$1000s 4 Net Loss 5 Adjusted for: 6 Depreciation and amortization 7 Interest (income) expense, net 8 Income tax provision (benefit) 9 Stock-based compensation 10 Transaction-related costs 11 Litigation, settlement, and related costs 12 Advocacy and other related legal expenses 13 (Gain) loss on remeasurement of warrant liabilities 14 Other non-recurring, non-operating (income) costs 15 Adjusted EBITDA 16 Percent of total revenue 17 18 Adjusted EBITDA by segment: 19 B2C 20 B2B 21 D E 2019 2020 2021 -142,734 -1,231,835 -1,523,195 13,636 -1,348 77,410 121,138 1,070 -1,957 58 -622 8,269 17,613 325,038 683,293 10,472 36,406 25,316 3,695 6,839 10,392 0 0 40,415 0 387,565 -30,065 -32 -98,640 -30% 6,210 -391,919 -9,739 -676,133 -73% -56% -98,640 0 -393,461 1,542 -654,432 -21,701 22 Note: B2C = business to consumer; B2B = business to business; EBITDA = earnings before interest, taxes, depreciation, and amortization 23 Source: DraftKings Inc. Form 10-K, accessed February 18, 2022, draftkings.gcs-web.com/static-files/66e061e7-35bd-47d4-861c-54a405d86f39 24 25 26 27 G LL A B D E 1 Exhibit 5: DraftKings Inc. Income Statements 2019-2021, In US$1000s 2 3 2019 2020 2021 4 Revenue 5 B2C 323,410 538,903 1,198,610 6 B2B 0 7 Total revenue 323,410 75,629 614,532 97,415 1,296,025 8 Growth rate 90% 111% 9 Cost of revenue 103,889 346,589 794,162 10 Gross Margin 11 Sales and marketing 12 Product and technology 13 General and administrative 14 EBITDA 219,521 267,943 501,863 185,269 495,192 981,500 55,929 168,633 253,655 111,232 369,964 707,187 -132,909 -765,846 -1,440,479 15 Percent of total revenue -41% -125% -111% 16 17 Depreciation 4,136 9,310 13,838 18 Amortization 9,500 68,100 107,300 19 EBIT -146,545 -843,256 -1,561,617 20 21 Interest income (expense), net 1,348 22 Gain (loss) on remeasurement of warrant liabilities 0 -1,070 -387,565 1,957 30,065 23 Other income, net 3,000 0 11,951 24 Loss before income tax provision (benefit) -142,197 -1,231,891 -1,517,644 25 26 Income tax provision (benefit) 27 (Gain) loss from equity method investment 28 Net loss attributable to common stockholders 29 58 479 -142,734 -622 566 -1,231,835 8,269 -2,718 -1,523,195 30 Loss per share attributable to common stockholders: 31 Number of shares 32 Earnings per share (EPS) 185,369 -0.77 305,666 -4.03 402,962 -3.78 33 34 Note: B2C = business to consumer; B2B = business to business; EBITDA = earnings before interest, taxes, depreciation, and amortization 35 Source: DraftKings Inc. Form 10-K, accessed February 18, 2022, draftkings.gcs-web.com/static-files/66e061e7-35bd-47d4-861c-54a405d86f39 36 37 38 39 40 A B D Exhibit 3: Legal U.S. Sports Betting Revenue, through January 2022, in US$ E G H State Total Handle Gross Sportsbook Revenue Sportsbook Win Percentage Adjusted Sportsbook Revenue State Taxes Collected Legal Betting Nevada New Jersey Delaware 20,766,815,513 24,131,937,192 1,228,243,000 5.91% 1,228,243,000 82,939,014 Start Date 1975 1,668,239,976 6.91% 1,668,239,976 206,958,857 Jun-18 459,371,387 93,630,534 20.38% 69,678,550 48,092,642 Jun-18 Mississippi West Virginia Pennsylvania O Rhode Island New York Arkansas 3 lowa Oregon 2,049,485,738 120,665,467 1,542,428,243 175,758,045 11.46% 175,758,045 21,098,437 Aug-18 1,285,763,675 102,736,871 7.99% 102,736,871 8,732,635 Aug-18 12,434,451,172 943,073,436 7.58% 648,610,441 220,527,554 Nov-18 935,956,274 81,656,579 8.72% 81,656,579 42,099,069 Nov-18 165,644,519 8.08% 165,644,519 67,567,738 Jun-19 15,346,612 12.72% 15,346,612 2,135,880 Jul-19 3,132,241,433 189,063,792 6.04% 189,063,792 13,840,538 Aug-19 638,017,898 55,783,990 8.74% 55,783,990 55,783,990 Aug-19 5 Indiana 6,534,181,495 521,596,777 7.98% 521,596,777 49,551,701 Sep-19 5 New Hampshire 996,814,908 66,861,018 6.71% 66,861,018 30,893,014 Dec-19 Illinois 8,904,618,834 650,567,426 7.31% 650,567,426 97,585,114 Mar-20 B Michigan 4,629,351,511 394,675,394 8.53% 197,238,705 10,441,376 Mar-20 O Montana Colorado 2 Tennessee 73,146,314 10,466,306 14.31% 10,466,306 10,466,581 Mar-20 5,033,281,691 325,917,335 6.48% 131,720,643 14,665,543 May-20 Washington DC 301,035,911 42,520,043 14.12% 42,520,043 4,248,125 May-20 3,428,549,656 302,138,853 8.81% 252,406,168 50,801,422 Nov-20 B Virginia 3,221,791,416 285,895,663 8.87% 130,867,158 20,340,033 Jan-21 Arizona 1,244,035,908 118,227,348 9.50% 42,647,145 4,231,382 Sep-21 5 South Dakota 2,651,489 254,582 9.60% 254,582 22,913 Sep-21 5 Wyoming Connecticut 3 Louisiana 40,348,146 4,009,667 9.94% 1,240,537 124,312 Sep-21 494,536,889 40,916,924 8.27% 31,250,431 4,296,933 Oct-21 67,134,595 10,066,636 14.99% 10,066,636 1,006,664 Nov-21 9 Maryland Totals 49,083,261 $102,517,696,016 7,545,316 $7,500,836,642 15.37% 7.32% 7,422,649 $6,497,888,538 1,113,395 $1,069,564,862 Dec-21 , 2 Notes: Nevada has had legal sports betting since 1975; New Jersey was the first state outside of Nevada to allow legal sports betting. Nevada totals in the exhibit start in June 2018. 3 Source: Chris Altruda, Legal US Sports Betting Revenue, Handle And Tax Totals Since PASPA Repeal," accessed February 27, 2022, sportshandle.com/sports-betting-revenue/
Step by Step Solution
There are 3 Steps involved in it

Get step-by-step solutions from verified subject matter experts