

Question: A B C D E F G H | J K L M N 47 Let's say that Apple believes families have become comfortable
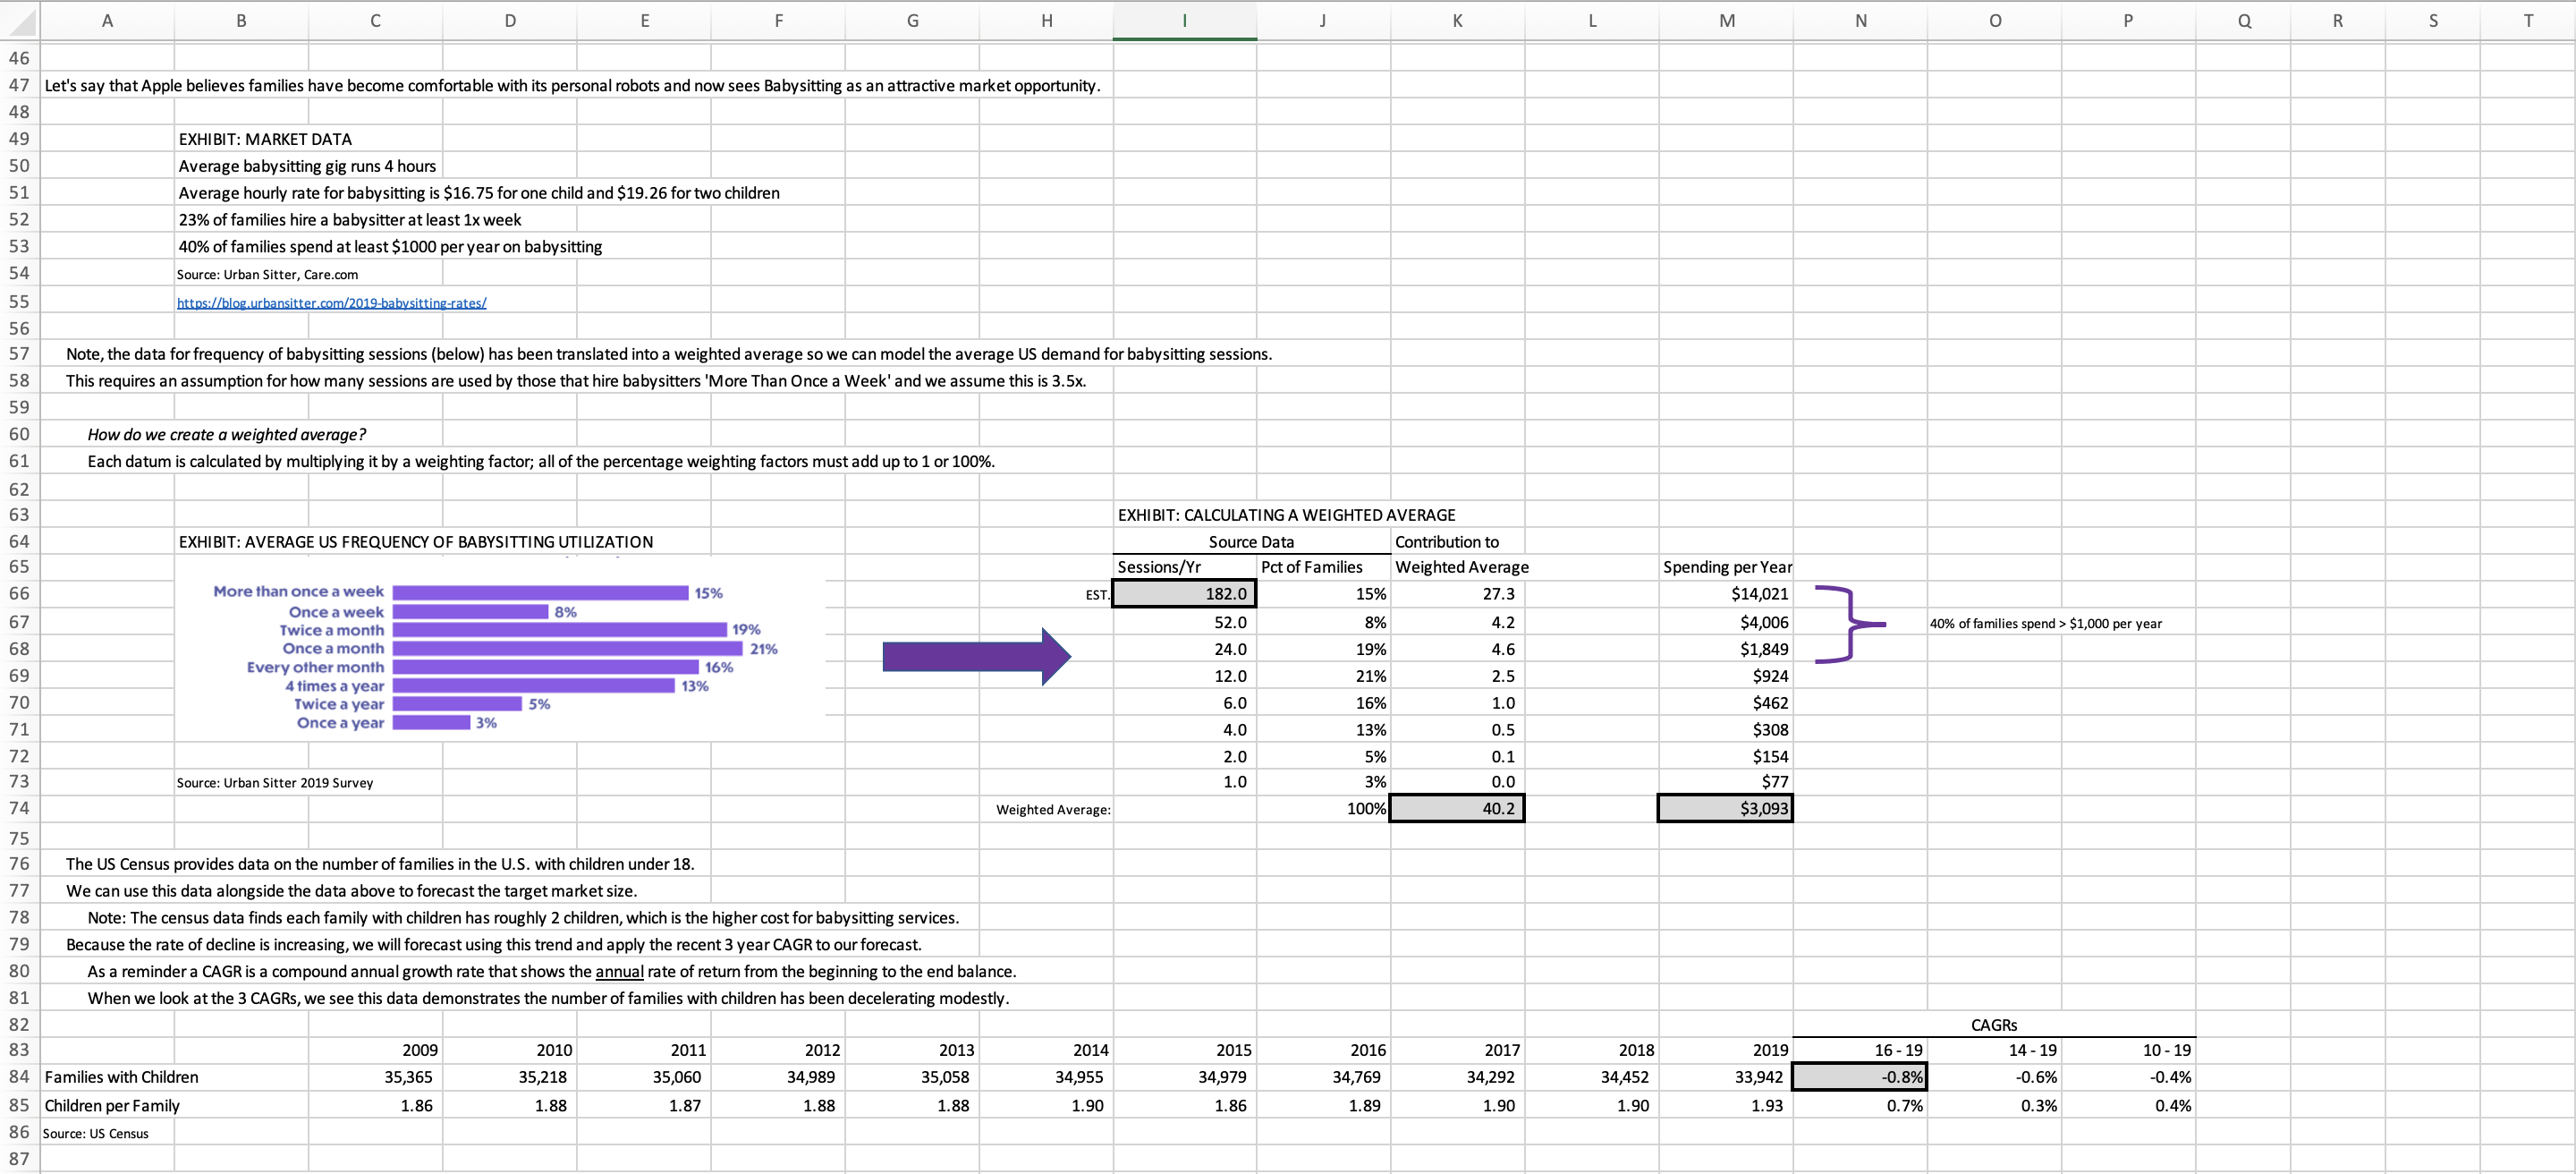
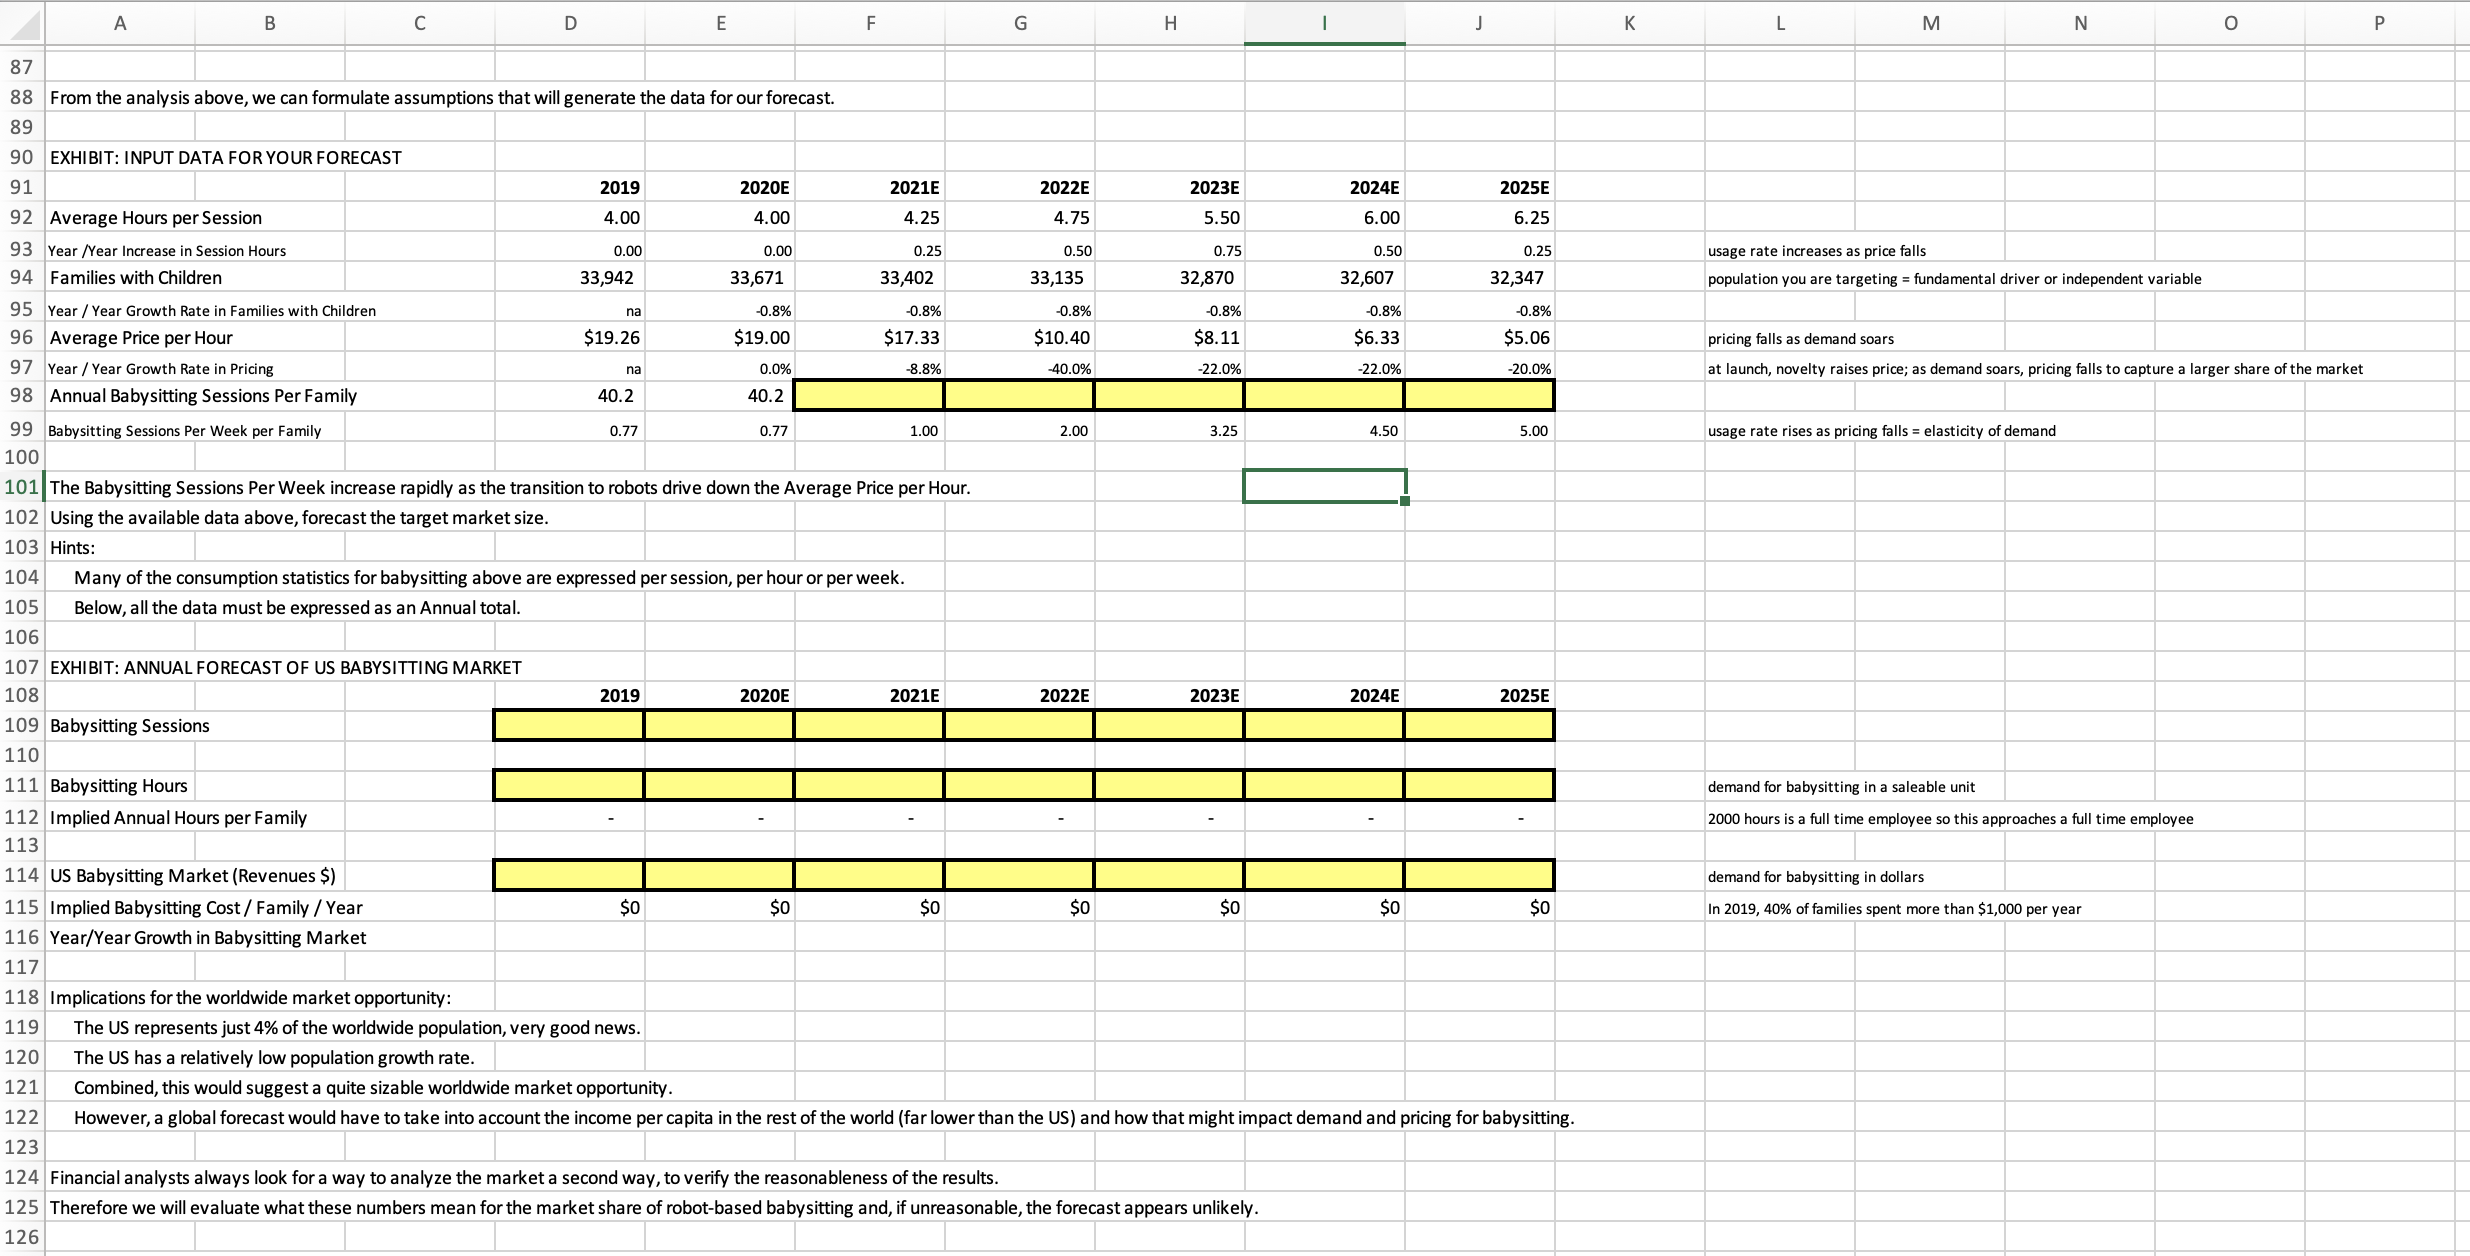
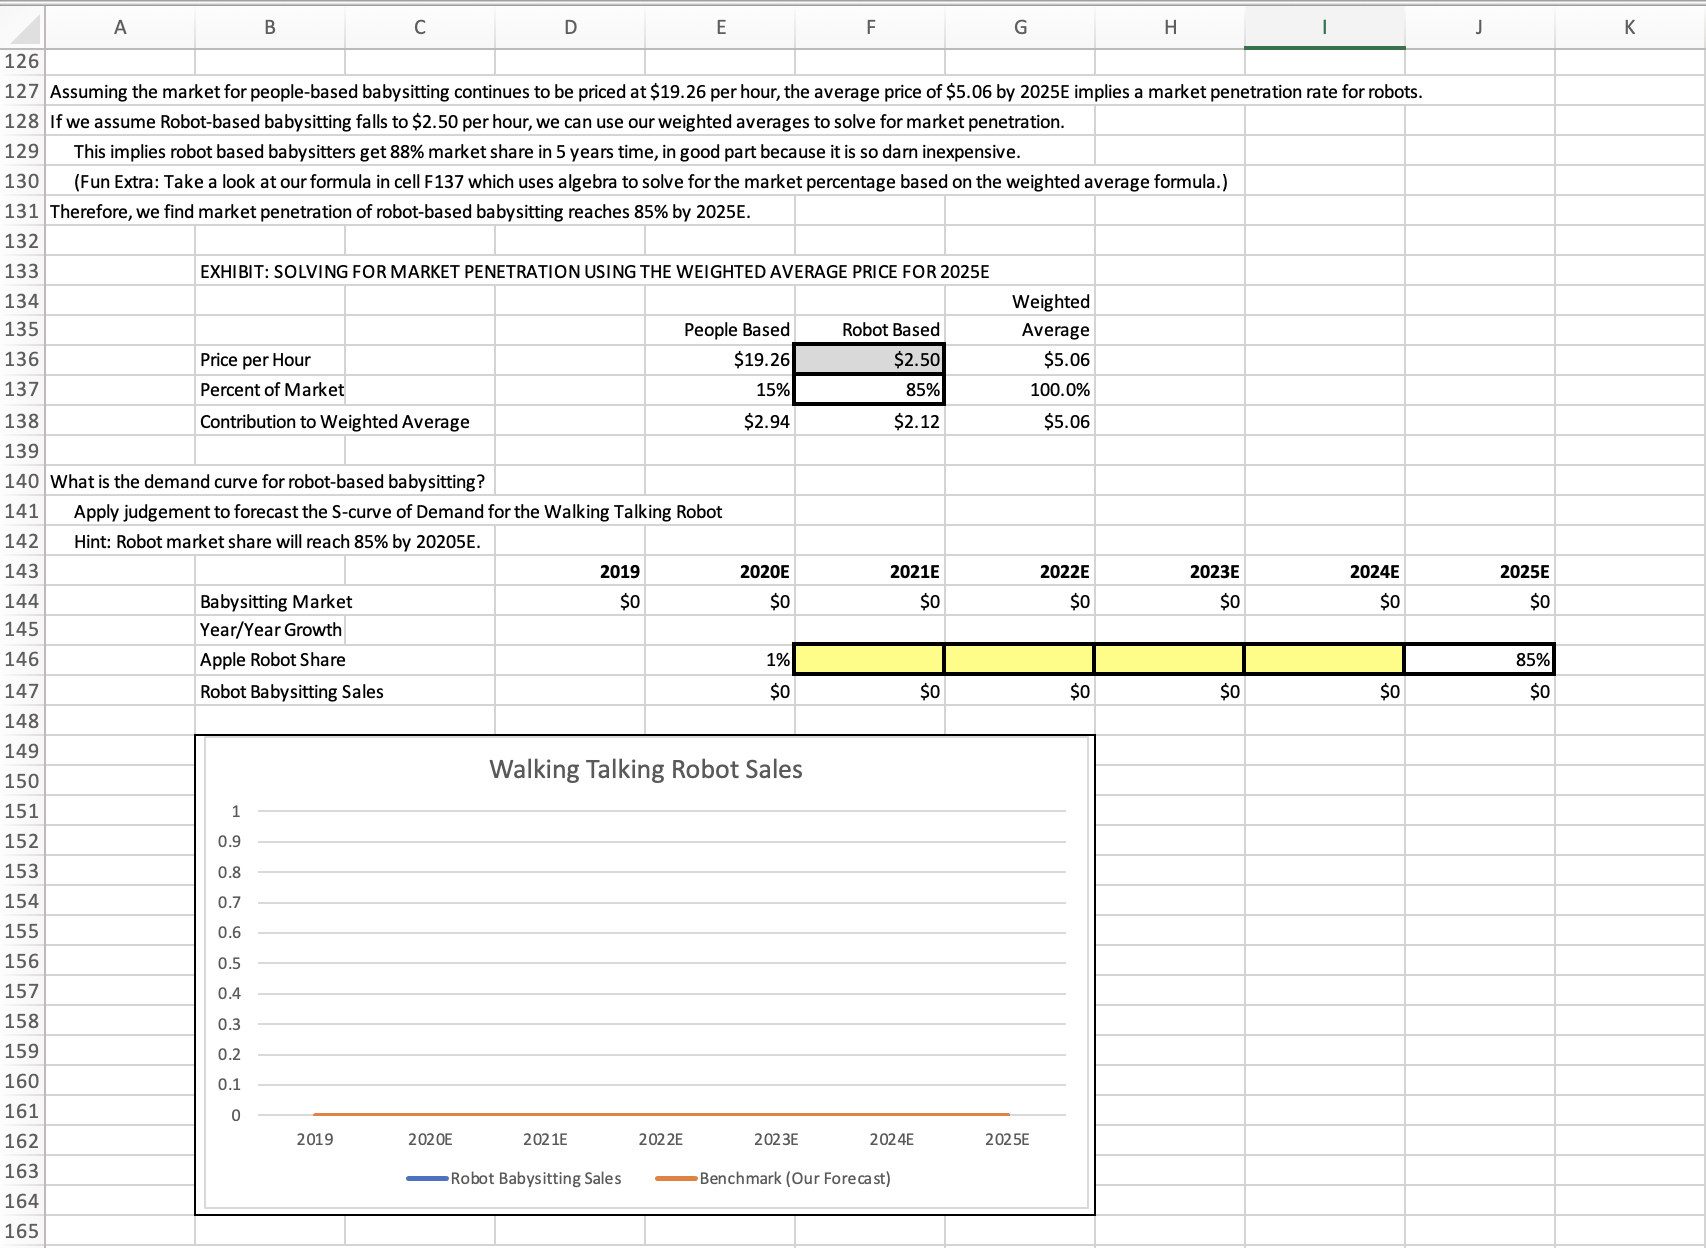
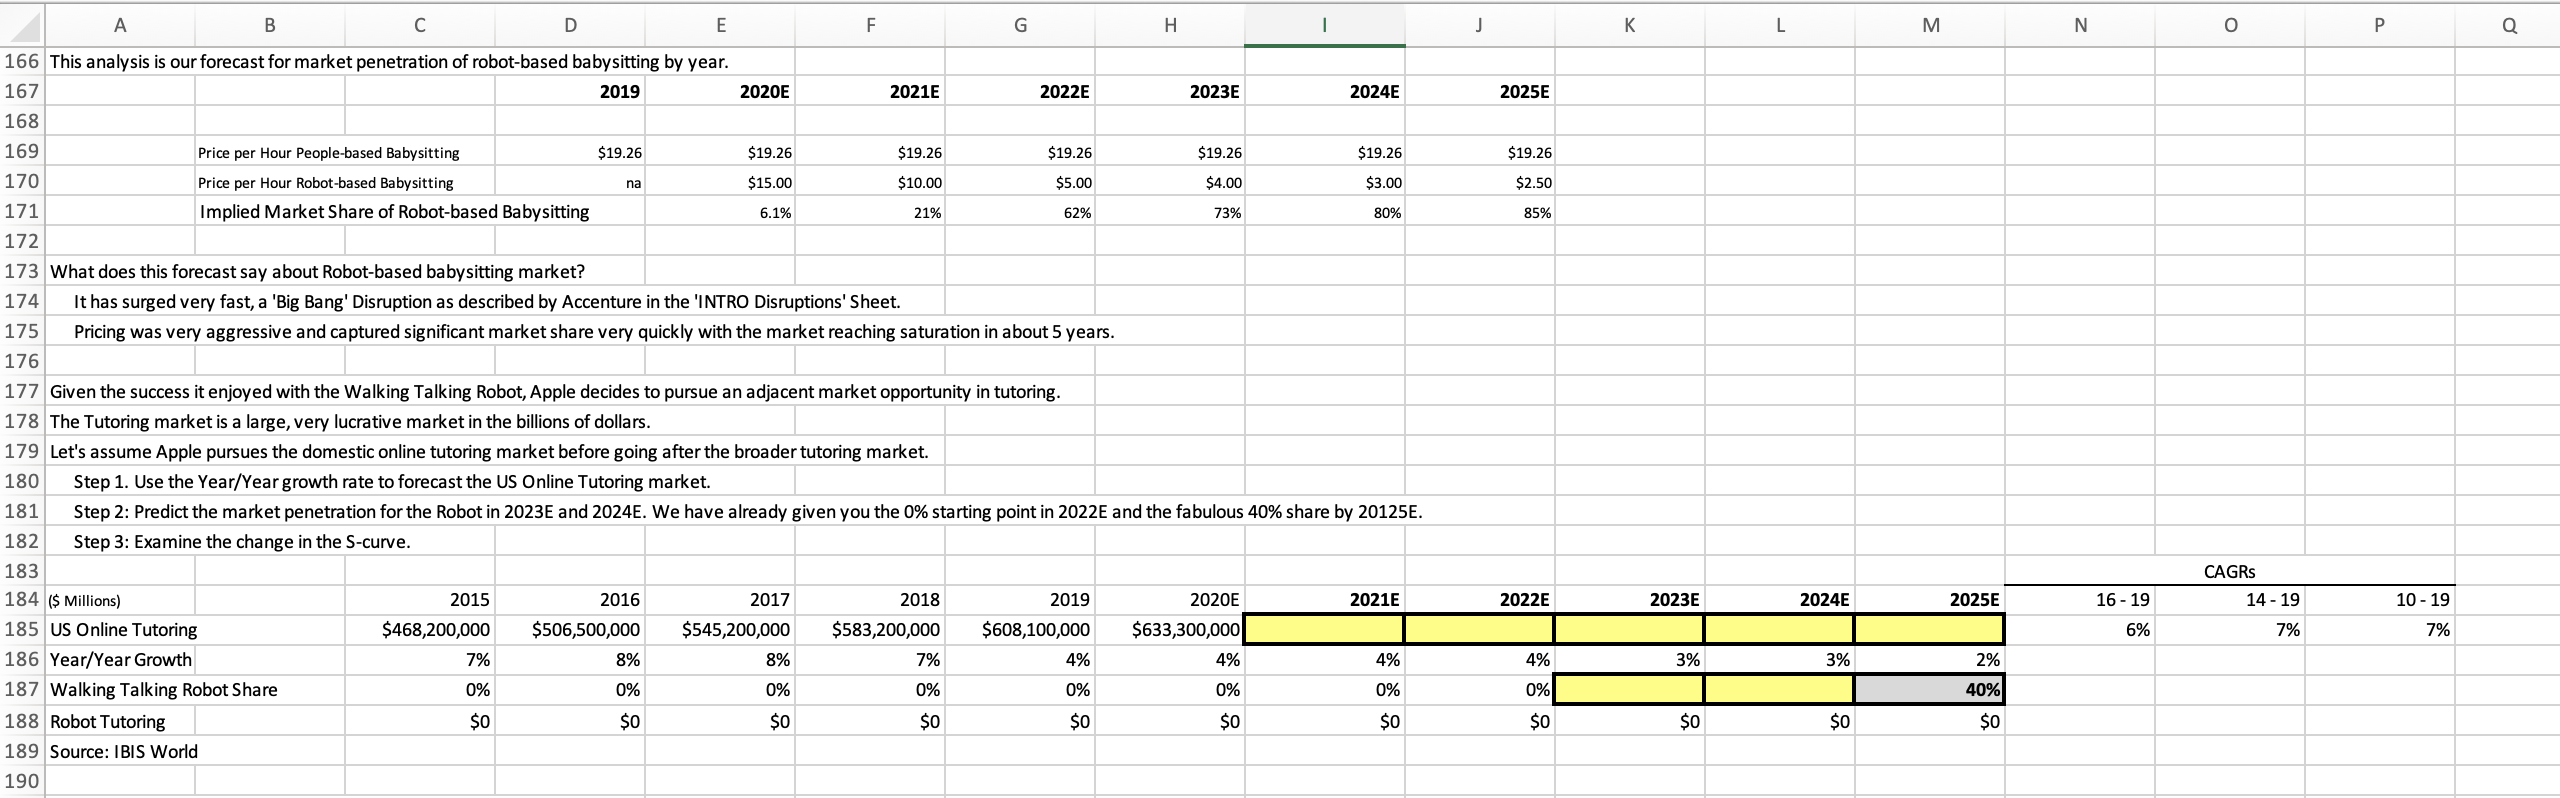
A B C D E F G H | J K L M N 47 Let's say that Apple believes families have become comfortable with its personal robots and now sees Babysitting as an attractive market opportunity. 46 0 P Q R 48 49 50 EXHIBIT: MARKET DATA Average babysitting gig runs 4 hours 51 Average hourly rate for babysitting is $16.75 for one child and $19.26 for two children 52 23% of families hire a babysitter at least 1x week 53 40% of families spend at least $1000 per year on babysitting 54 55 Source: Urban Sitter, Care.com https://blog.urbansitter.com/2019-babysitting-rates/ 56 57 58 Note, the data for frequency of babysitting sessions (below) has been translated into a weighted average so we can model the average US demand for babysitting sessions. This requires an assumption for how many sessions are used by those that hire babysitters 'More Than Once a Week' and we assume this is 3.5x. 59 60 How do we create a weighted average? 61 Each datum is calculated by multiplying it by a weighting factor; all of the percentage weighting factors must add up to 1 or 100%. 62 63 64 EXHIBIT: AVERAGE US FREQUENCY OF BABYSITTING UTILIZATION 65 66 More than once a week Once a week 67 68 69 Twice a month Once a month Every other month 4 times a year 70 71 15% 19% 21% 16% 13% Twice a year 5% Once a year 3% 8% 72 73 Source: Urban Sitter 2019 Survey 74 EXHIBIT: CALCULATING A WEIGHTED AVERAGE Source Data Sessions/Yr Pct of Families EST. 182.0 15% Contribution to Weighted Average 27.3 Spending per Year $14,021 52.0 8% 4.2 $4,006 40% of families spend > $1,000 per year 24.0 19% 4.6 $1,849 12.0 21% 2.5 $924 6.0 16% 1.0 $462 4.0 13% 0.5 $308 2.0 5% 0.1 $154 1.0 3% 0.0 $77 Weighted Average: 100% 40.2 $3,093 75 76 The US Census provides data on the number of families in the U.S. with children under 18. 77 We can use this data alongside the data above to forecast the target market size. 78 Note: The census data finds each family with children has roughly 2 children, which is the higher cost for babysitting services. 79 Because the rate of decline is increasing, we will forecast using this trend and apply the recent 3 year CAGR to our forecast. 80 81 As a reminder a CAGR is a compound annual growth rate that shows the annual rate of return from the beginning to the end balance. When we look at the 3 CAGRS, we see this data demonstrates the number of families with children has been decelerating modestly. 82 CAGRS 83 2009 2010 84 Families with Children 35,365 35,218 2011 35,060 2012 34,989 2013 35,058 2014 2015 2016 34,955 34,979 34,769 2017 34,292 2018 2019 16-19 14-19 10-19 34,452 33,942 -0.8% -0.6% -0.4% 85 Children per Family 1.86 1.88 1.87 1.88 1.88 1.90 1.86 1.89 1.90 1.90 1.93 0.7% 0.3% 0.4% 86 Source: US Census 87 S T 87 A B D E F G H | J K L M N 88 From the analysis above, we can formulate assumptions that will generate the data for our forecast. 89 90 EXHIBIT: INPUT DATA FOR YOUR FORECAST 91 92 Average Hours per Session 93 Year/Year Increase in Session Hours 94 Families with Children 95 Year/Year Growth Rate in Families with Children 96 Average Price per Hour 97 Year/Year Growth Rate in Pricing 98 Annual Babysitting Sessions Per Family 99 Babysitting Sessions Per Week per Family 100 0 2019 2020E 2021E 2022E 2023E 4.00 4.00 4.25 4.75 5.50 2024E 6.00 2025E 6.25 0.00 0.00 0.25 0.50 0.75 0.50 0.25 33,942 33,671 33,402 33,135 32,870 32,607 32,347 usage rate increases as price falls population you are targeting = fundamental driver or independent variable na $19.26 -0.8% $19.00 -0.8% $17.33 -0.8% -0.8% $10.40 $8.11 -0.8% $6.33 -0.8% $5.06 na 40.2 0.0% 40.2 -8.8% -40.0% -22.0% -22.0% -20.0% pricing falls as demand soars at launch, novelty raises price; as demand soars, pricing falls to capture a larger share of the market 0.77 0.77 1.00 2.00 3.25 4.50 5.00 usage rate rises as pricing falls = elasticity of demand 101 The Babysitting Sessions Per Week increase rapidly as the transition to robots drive down the Average Price per Hour. 102 Using the available data above, forecast the target market size. 103 Hints: 104 105 Many of the consumption statistics for babysitting above are expressed per session, per hour or per week. Below, all the data must be expressed as an Annual total. 106 107 EXHIBIT: ANNUAL FORECAST OF US BABYSITTING MARKET 108 109 Babysitting Sessions 110 111 Babysitting Hours 112 Implied Annual Hours per Family 113 114 US Babysitting Market (Revenues $) 115 Implied Babysitting Cost / Family/Year 116 Year/Year Growth in Babysitting Market 117 118 Implications for the worldwide market opportunity: 2019 2020E 2021E 2022E 2023E 2024E 2025E demand for babysitting in a saleable unit 2000 hours is a full time employee so this approaches a full time employee demand for babysitting in dollars $0 $0 $0 $0 $0 $0 $0 In 2019, 40% of families spent more than $1,000 per year 119 The US represents just 4% of the worldwide population, very good news. 120 The US has a relatively low population growth rate. 121 Combined, this would suggest a quite sizable worldwide market opportunity. 122 123 However, a global forecast would have to take into account the income per capita in the rest of the world (far lower than the US) and how that might impact demand and pricing for babysitting. 124 Financial analysts always look for a way to analyze the market a second way, to verify the reasonableness of the results. 125 Therefore we will evaluate what these numbers mean for the market share of robot-based babysitting and, if unreasonable, the forecast appears unlikely. 126 P 126 A B C D E F G H 127 Assuming the market for people-based babysitting continues to be priced at $19.26 per hour, the average price of $5.06 by 2025E implies a market penetration rate for robots. 128 If we assume Robot-based babysitting falls to $2.50 per hour, we can use our weighted averages to solve for market penetration. J K 129 This implies robot based babysitters get 88% market share in 5 years time, in good part because it is so darn inexpensive. 130 (Fun Extra: Take a look at our formula in cell F137 which uses algebra to solve for the market percentage based on the weighted average formula.) 131 Therefore, we find market penetration of robot-based babysitting reaches 85% by 2025E. 132 133 134 135 136 Price per Hour 137 Percent of Market 138 Contribution to Weighted Average EXHIBIT: SOLVING FOR MARKET PENETRATION USING THE WEIGHTED AVERAGE PRICE FOR 2025E Weighted People Based $19.26 Robot Based Average $2.50 $5.06 15% 85% 100.0% $2.94 $2.12 $5.06 139 140 What is the demand curve for robot-based babysitting? 141 Apply judgement to forecast the S-curve of Demand for the Walking Talking Robot 142 Hint: Robot market share will reach 85% by 20205E. 143 144 Babysitting Market 2019 2020E $0 $0 2021E $0 2022E $0 2023E $0 2024E 2025E $0 $0 0 145 Year/Year Growth 146 Apple Robot Share 147 Robot Babysitting Sales 1% 85% $0 $0 $0 $0 $0 $0 148 149 150 Walking Talking Robot Sales 151 1 152 0.9 153 0.8 154 0.7 155 0.6 156 0.5 157 0.4 158 0.3 159 0.2 160 0.1 161 0 162 2019 2020E 2021E 2022E 2023E 2024E 2025E 163 Robot Babysitting Sales -Benchmark (Our Forecast) 164 165 A B D E 166 This analysis is our forecast for market penetration of robot-based babysitting by year. 167 168 2019 2020E FL 2021E G 2022E H 2023E 2024E J 2025E K L M N P Q 169 Price per Hour People-based Babysitting $19.26 $19.26 $19.26 $19.26 $19.26 $19.26 $19.26 170 Price per Hour Robot-based Babysitting na $15.00 $10.00 $5.00 $4.00 $3.00 $2.50 171 Implied Market Share of Robot-based Babysitting 6.1% 21% 62% 73% 80% 85% 172 173 What does this forecast say about Robot-based babysitting market? 174 It has surged very fast, a 'Big Bang' Disruption as described by Accenture in the 'INTRO Disruptions' Sheet. 175 Pricing was very aggressive and captured significant market share very quickly with the market reaching saturation in about 5 years. 176 177 Given the success it enjoyed with the Walking Talking Robot, Apple decides to pursue an adjacent market opportunity in tutoring. 178 The Tutoring market is a large, very lucrative market in the billions of dollars. 179 Let's assume Apple pursues the domestic online tutoring market before going after the broader tutoring market. 180 Step 1. Use the Year/Year growth rate to forecast the US Online Tutoring market. 181 182 Step 2: Predict the market penetration for the Robot in 2023E and 2024E. We have already given you the 0% starting point in 2022E and the fabulous 40% share by 20125E. Step 3: Examine the change in the S-curve. 183 184 ($ Millions) 185 US Online Tutoring 186 Year/Year Growth 187 Walking Talking Robot Share 188 Robot Tutoring 189 Source: IBIS World 190 CAGRs 2015 2016 2017 2018 2019 2020E 2021E 2022E 2023E 2024E 2025E $468,200,000 $506,500,000 $545,200,000 $583,200,000 $608,100,000 $633,300,000 16-19 6% 14-19 7% 10-19 7% 7% 8% 8% 7% 4% 4% 4% 4% 3% 3% 2% 0% 0% 0% 0% 0% 0% 0% 0% 40% $0 $0 $0 $0 $0 $0 $0 $0 $0 $0 $0
Step by Step Solution
There are 3 Steps involved in it

Get step-by-step solutions from verified subject matter experts