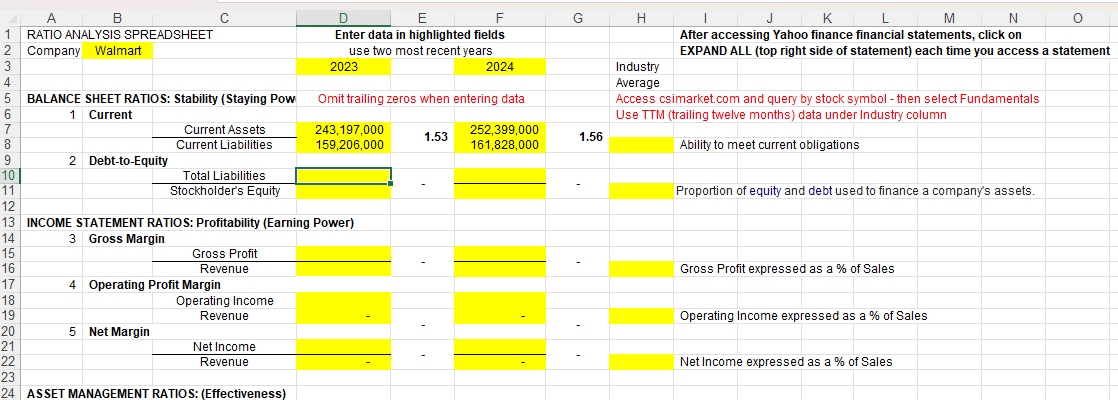
Question: A B c D E F G H | J K L M N 0 1 | RATIO AMALYSIS SPREADSHEET Enter data in highlighted fields

A B c D E F G H | J K L M N 0 1 | RATIO AMALYSISA B c D E F G H | J K L M N 0 1 | RATIO AMALYSIS
A B c D E F G H | J K L M N 0 1 | RATIO AMALYSIS SPREADSHEET Enter data in highlighted fields After accessing Yahoo finance financial statements, click on 2 | Company Walmart use two most recent years EXPAND ALL (top right side of statement) each time you access a statement 3 2023 2024 Industry 4 Average 5 | BALANCE SHEET RATIOS: Stability {Staying Pow Omit trailing zeros when entering data Access csimarket.com and query by stock symbol - then select Fundamentals 6 1 Current Use TTM (trailing twelve months) data under Industry column T Current Assets 243197 000 153 252,399 000 1.56 8 Current Liabilities 159,206,000 ' 161,828,000 ' Ability to meet current obligations 9 2 Debt-to-Equity 10] Total Liabilities 1 i 11 Stockholders Equity Proportion of equity and debt used to finance a company's assets. 12 13 | INCOME STATEMENT RATIOS: Profitability (Earning Power) 14 3 Gross Margin 15 Gross Profit 16 Revenue - . Gross Profit expressed as a % of Sales 17 4 Operating Profit Margin 18 Operating Income 19 Revenue - - Operating Income expressed as a % of Sales 20 5 Net Margin " ) 21 Net Income 22 Revenue - - - - MetIncome expressed as a % of Sales 23 24 | ASSET MANAGEMENT RATIOS: (Effectiveness) A B C D E F G H J K L M N 26 Cash flow from Operations 27 Net Income n/a Measures cash generated from sales; higher % the better 28 7 Return on Assets 29 Net Income 30 Total Assets Measures the profitability of using the assets 31 8 Return on Equity 32 Net Income 33 Stockholder's Equity Measures the profitability of the stockholders investment 34 35 ASSET MANAGEMENT RATIOS: Working Capital Cycle Ratios/Efficiency 36 9 Inventory Turnover 37 Cost of Revenue/Goods Sold 38 Inventory Measures the efficiency of moving the inventory 39 10 Inventory Turn-Days 40 360 360 360 41 Inventory Turnover Average # of days it takes to move inventory 11 Accounts Receivable Turnover 43 Revenue Measures the efficiency of collecting Accounts Receivable 44 Accounts Receivable 45 12 Accounts Receivable Turn-Days 46 360 360 360 17 Accts. Rec. Turnover Average # of days it takes to collect Accounts Receivable 48 13 Accounts Payable Turnover 19 Cost of Revenue/Goods Sol 50 Accounts Payable n/a Measures the efficiency of paying Accounts Payable

Step by Step Solution

There are 3 Steps involved in it

1 Expert Approved Answer
Step: 1 Unlock blur-text-image
Question Has Been Solved by an Expert!

Get step-by-step solutions from verified subject matter experts

Step: 2 Unlock
Step: 3 Unlock

Students Have Also Explored These Related Finance Questions!