

Question: A B C D E F G H J K L M Time series plot Year Month Demand 2015 January 1560 Paste your time series
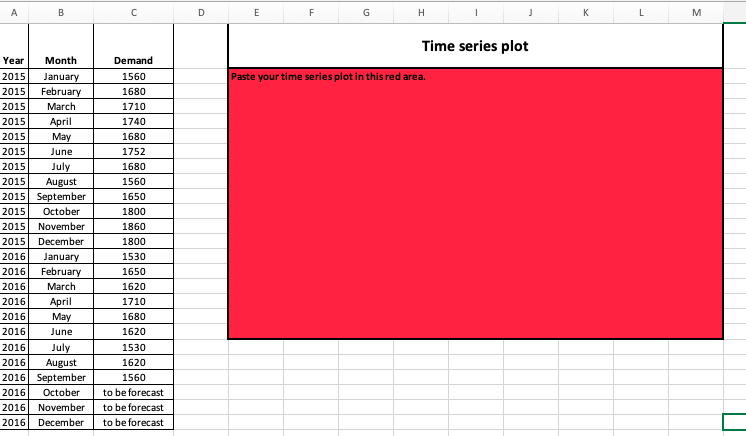
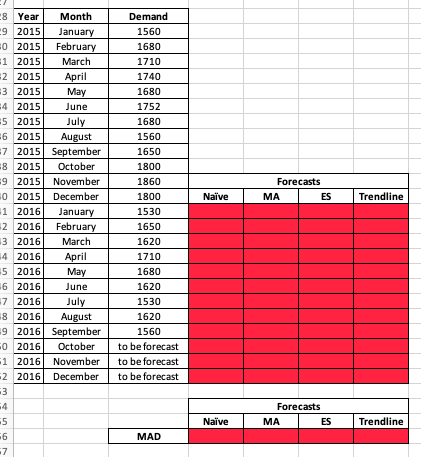
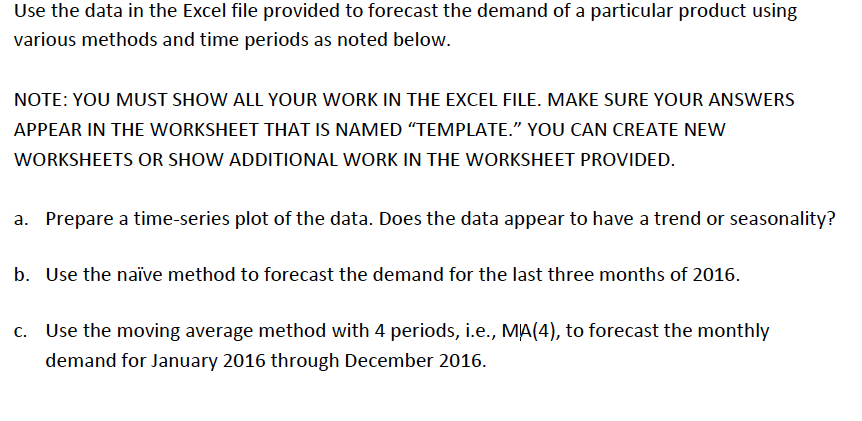
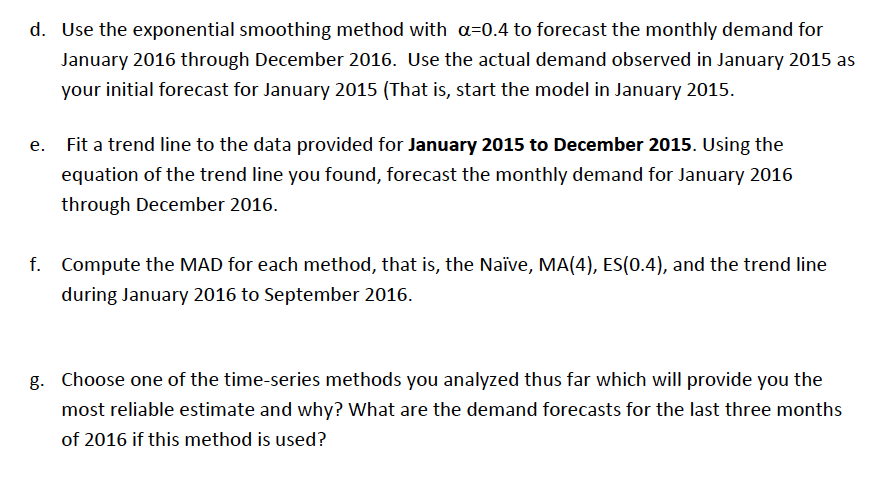
A B C D E F G H J K L M Time series plot Year Month Demand 2015 January 1560 Paste your time series plot in this red area. 2015 February 1680 2015 March 1710 2015 April 1740 2015 May 1680 2015 June 1752 2015 July 1680 2015 August 1560 2015 September 1650 2015 October 1800 2015 November 1860 2015 December 1800 2016 January 1530 2016 February 1650 2016 March 1620 2016 April 1710 2016 May 1680 2016 June 1620 2016 July 1530 2016 August 1620 2016 September 1560 2016 October to be forecast 2016 November to be forecast 2016 December to be forecastYear Month Demand 2015 January 1560 2015 February 1680 2015 March 1710 2015 April 1740 2015 May 1680 2015 June 1752 2015 July 1680 6 2015 August 1560 2015 September 1650 2015 October 1800 2015 November 1860 Forecasts 2015 December 1800 Naive MA ES Trendline 2016 January 1530 2016 February 1650 2016 March 1620 2016 April 1710 2016 Mary 1680 2016 June 1620 2016 July 1530 2016 August 1620 9 2016 September 1560 2016 October to be forecast 2016 November to be forecast 2016 December to be forecast Forecasts Naive MA ES Trendline MADUse the data in the Excel file provided to forecast the demand of a particular product using various methods and time periods as noted below. NOTE: YOU MUST SHOW ALL YOUR WORK IN THE EXCEL FILE. MAKE SURE YOUR ANSWERS APPEAR IN THE WORKSHEET THAT IS NAMED "TEMPLATE.\" YOU CAN CREATE NEW WORKSHEETS OR SHOW ADDITIONAL WORK IN THE WORKSHEET PROVIDED. 3. Prepare a timeseries plot of the data. Does the data appear to have a trend or seasonality? b. Use the naive method to forecast the demand for the last three months of 2016. c. Use the moving average method with 4 periods, i.e., MAM}, to forecast the monthlv demand for January 2016 through December 2016. d. Use the exponential smoothing method with (FDA to forecast the monthly demand for January 2016 through December 2016. Use the actual demand observed in January 2015 as your initial forecast for January 2015 {That is, start the model in January 2015. e. Fit a trend line to the data provided for January 2015 to December 2015. Using the equation of the trend line you found, forecast the monthly demand for January 2016 through December 2016. f. Compute the MAD for each method, that is, the Naive, MAM], ES(0.4), and the trend line during January 2016 to September 2016. 3. Choose one of the timeseries methods you analyzed thus far which will provide you the most reliable estimate and why? What are the demand forecasts for the last three months of 2016 if this method is used
Step by Step Solution
There are 3 Steps involved in it

Get step-by-step solutions from verified subject matter experts