

Question: A B C D E F G H J K L M N X-bar Chart Problem 1) A quality control inspector at an iced coffee
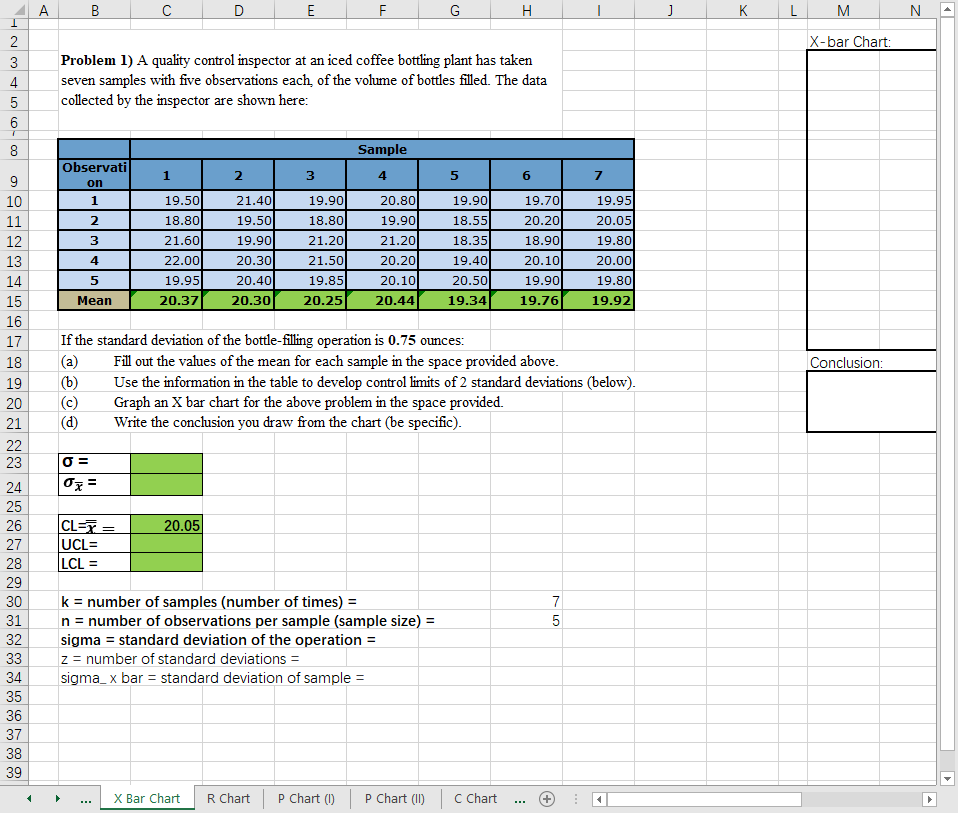
A B C D E F G H J K L M N X-bar Chart Problem 1) A quality control inspector at an iced coffee bottling plant has taken seven samples with five observations each, of the volume of bottles filled. The data collected by the inspector are shown here: 8 Sample Observati 2 3 4 5 6 9 on 10 1 19.50 21.40 19.90 20.80 19.90 19.70 19.95 11 2 18.80 19.50 18.80 19.90 18.55 20.20 20.05 12 21.60 19.90 21.20 21.20 8.35 18.90 19.80 13 22.00 20.30 21.50 20.20 19.40 20.10 20.00 14 5 19.95 20.4 19.85 20.10 20.50 19.90 19.80 15 Mean 20.37 20.30 20.25 20.44 19.34 19.76 19.92 16 17 If the standard deviation of the bottle-filling operation is 0.75 ounces: 18 (a) Fill out the values of the mean for each sample in the space provided above. Conclusion 19 (b ) Use the information in the table to develop control limits of 2 standard deviations (below). 20 (C) Graph an X bar chart for the above problem in the space provided 21 (d) Write the conclusion you draw from the chart (be specific). 22 23 O= 24 OF = 25 26 20.05 27 UCL= 28 LCL = 29 30 k = number of samples (number of times) = on - 31 n = number of observations per sample (sample size) = 32 sigma = standard deviation of the operation = 33 z = number of standard deviations = 34 sigma_ x bar = standard deviation of sample = 35 36 37 38 39 X Bar Chart R Chart P Chart (1) P Chart (II) C Chart ... + 0
Step by Step Solution
There are 3 Steps involved in it

Get step-by-step solutions from verified subject matter experts