

Question: A B C D E F G H | K L M N P Q R S T U 12345678 5 Quarter 1 6
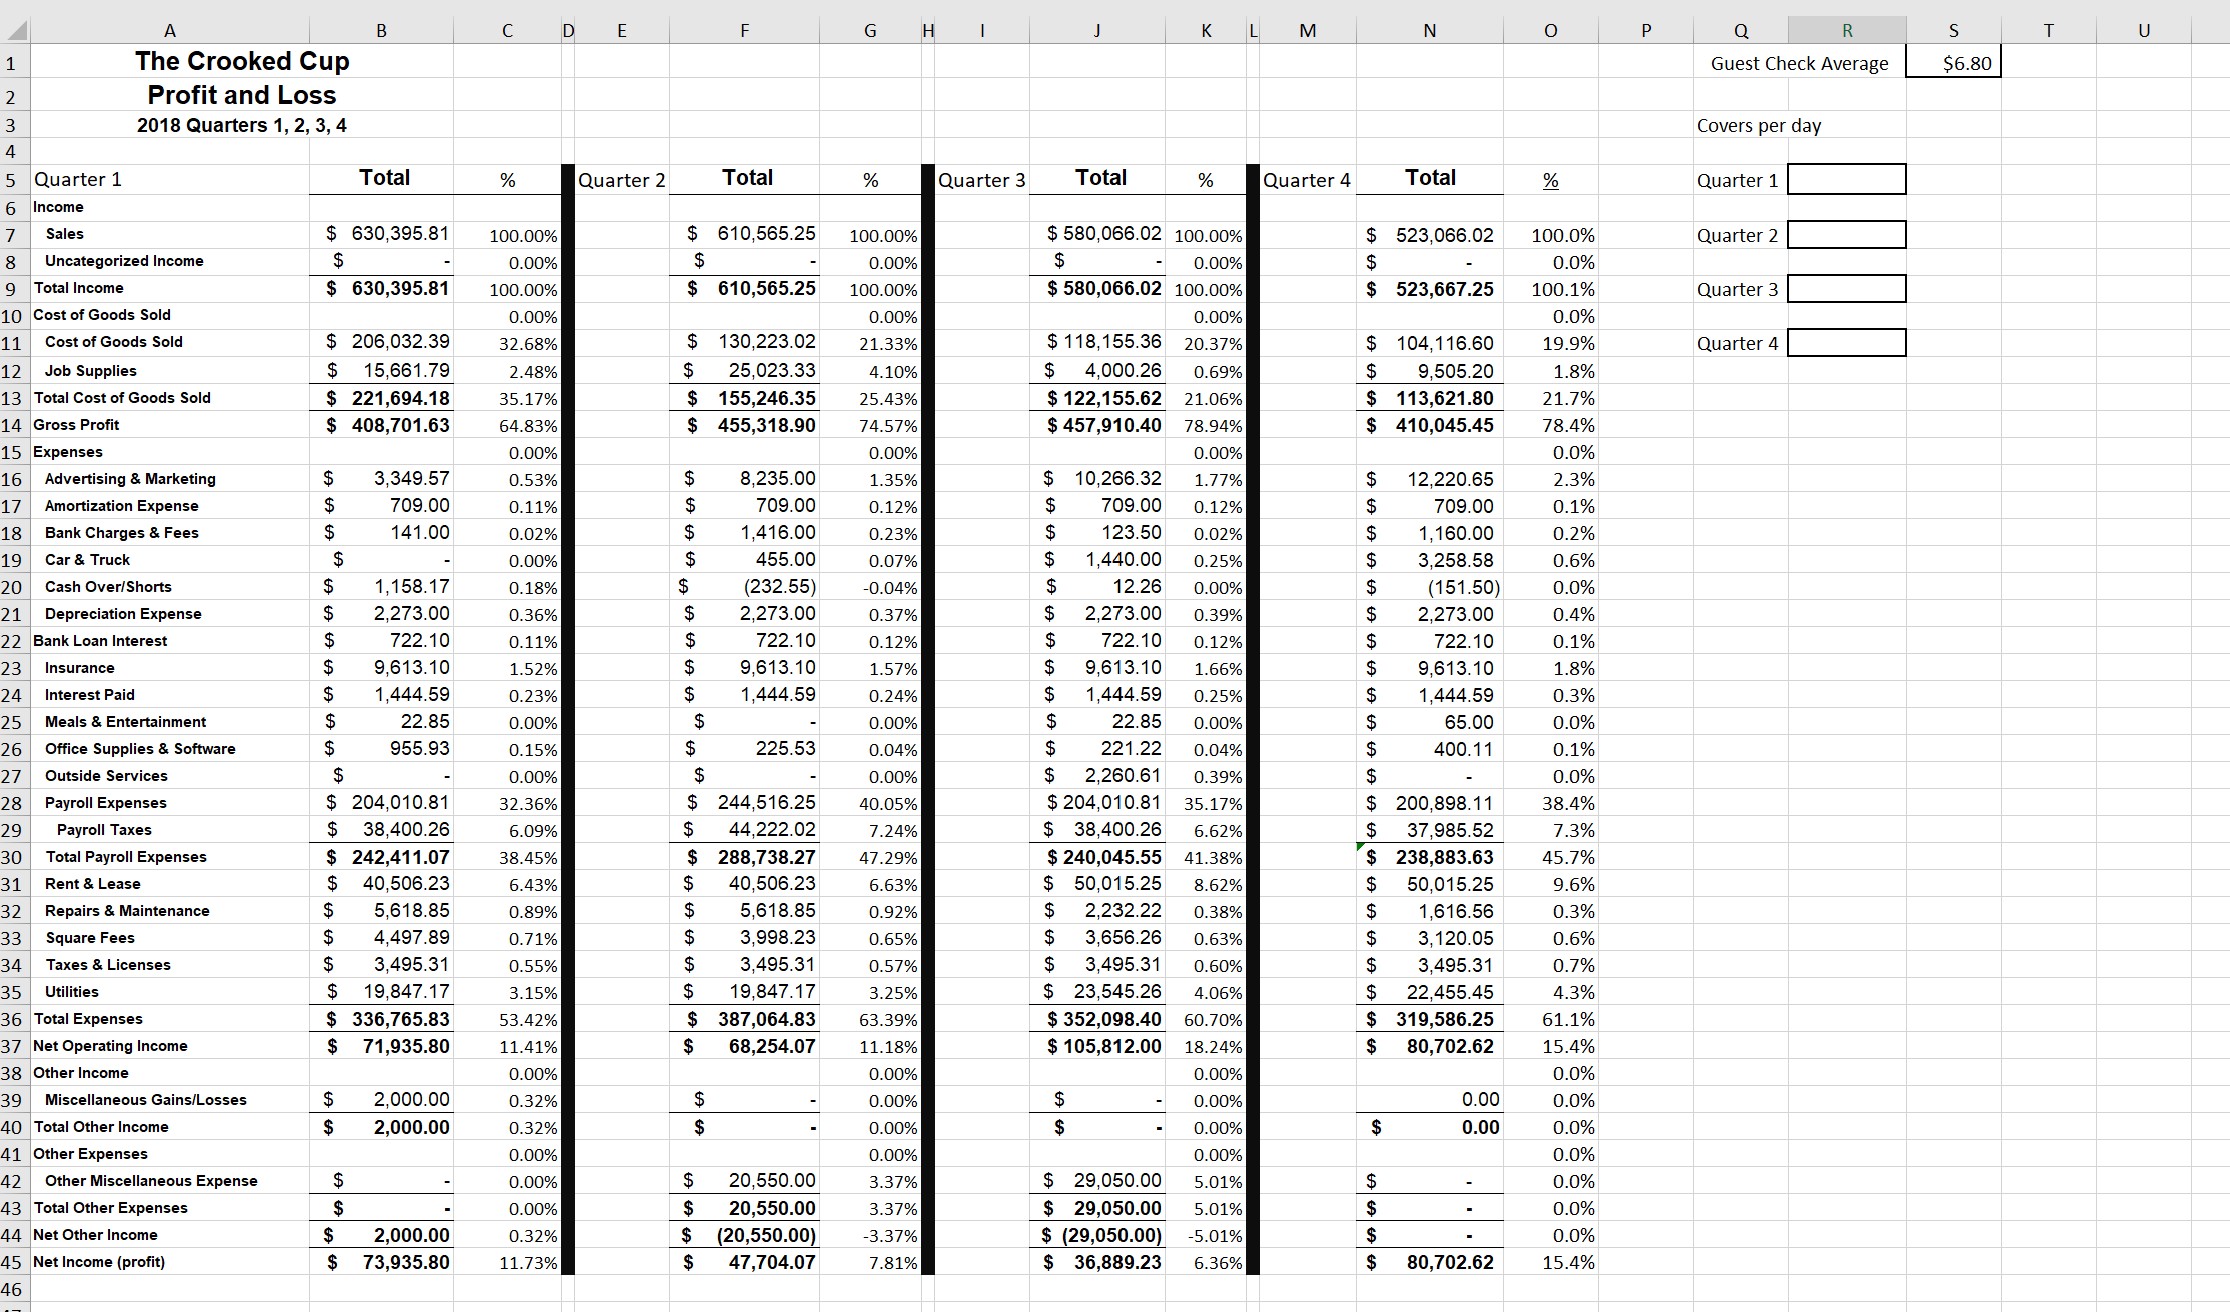
A B C D E F G H | K L M N P Q R S T U 12345678 5 Quarter 1 6 Income Sales The Crooked Cup Profit and Loss 2018 Quarters 1, 2, 3, 4 Guest Check Average $6.80 Covers per day Total % Quarter 2 Total % Quarter 3 Total % Quarter 4 Total % Quarter 1 Uncategorized Income $ 630,395.81 $ 100.00% 0.00% $ 610,565.25 $ 100.00% 0.00% $ 9 Total Income $ 630,395.81 100.00% $ 610,565.25 100.00% 10 Cost of Goods Sold 0.00% 11 Cost of Goods Sold $ 206,032.39 32.68% $ 130,223.02 12 Job Supplies $ 15,661.79 2.48% $ 25,023.33 13 Total Cost of Goods Sold $ 221,694.18 35.17% $ 155,246.35 14 Gross Profit $ 408,701.63 64.83% $ 455,318.90 0.00% 21.33% 4.10% 25.43% 74.57% $580,066.02 100.00% 0.00% $580,066.02 100.00% 0.00% $ 523,066.02 $ 100.0% Quarter 2 $ 523,667.25 0.0% 100.1% Quarter 3 0.0% $ 4,000.26 $ 118,155.36 20.37% 0.69% $ 104,116.60 19.9% Quarter 4 $ 9,505.20 1.8% $ 122,155.62 $ 457,910.40 21.06% 78.94% $ 113,621.80 21.7% $ 410,045.45 78.4% 15 Expenses 0.00% 0.00% 0.00% 0.0% 16 Advertising & Marketing $ 3,349.57 0.53% $ 8,235.00 1.35% $ 10,266.32 1.77% $ 12,220.65 2.3% 17 Amortization Expense $ 709.00 0.11% $ 709.00 0.12% $ 709.00 0.12% $ 709.00 0.1% 18 Bank Charges & Fees $ 141.00 0.02% $ 1,416.00 0.23% $ 123.50 0.02% $ 1,160.00 0.2% 19 Car & Truck $ 0.00% $ 455.00 0.07% $ 1,440.00 0.25% $ 3,258.58 0.6% 20 Cash Over/Shorts $ 1,158.17 0.18% $ (232.55) -0.04% $ 12.26 0.00% $ (151.50) 0.0% 21 Depreciation Expense $ 2,273.00 0.36% $ 2,273.00 0.37% $ 2,273.00 0.39% $ 2,273.00 0.4% 22 Bank Loan Interest $ 722.10 0.11% $ 722.10 0.12% $ 722.10 0.12% $ 722.10 0.1% 23 Insurance $ 9,613.10 1.52% $ 9,613.10 1.57% $ 9,613.10 1.66% $ 9,613.10 1.8% 24 Interest Paid $ 1,444.59 0.23% $ 1,444.59 0.24% $ 1,444.59 0.25% $ 1,444.59 0.3% 25 Meals & Entertainment $ 22.85 0.00% $ 0.00% $ 26 Office Supplies & Software $ 955.93 0.15% $ 225.53 0.04% $ 22.85 221.22 0.00% $ 65.00 0.0% 0.04% $ 400.11 0.1% 27 Outside Services $ 0.00% $ 0.00% $ 2,260.61 0.39% $ 0.0% 28 Payroll Expenses $ 204,010.81 32.36% $ 244,516.25 40.05% $ 204,010.81 35.17% $ 200,898.11 38.4% 29 Payroll Taxes $ 38,400.26 6.09% $ 44,222.02 7.24% $ 38,400.26 6.62% $ 37,985.52 7.3% 30 Total Payroll Expenses $ 242,411.07 38.45% $ 288,738.27 47.29% $ 240,045.55 41.38% $ 238,883.63 45.7% 31 Rent & Lease $ 40,506.23 6.43% $ 40,506.23 6.63% $ 50,015.25 8.62% $ 50,015.25 9.6% 32 Repairs & Maintenance $ 5,618.85 0.89% $ 5,618.85 0.92% $ 2,232.22 0.38% $ 1,616.56 0.3% 33 Square Fees 34 Taxes & Licenses $ 4,497.89 3,495.31 0.71% $ 3,998.23 0.65% $ 3,656.26 0.63% $ 3,120.05 0.6% 0.55% $ 35 Utilities $ 19,847.17 3.15% $ 36 Total Expenses $ 336,765.83 53.42% 37 Net Operating Income $ 71,935.80 11.41% 3,495.31 19,847.17 $ 387,064.83 $ 68,254.07 0.57% 3.25% 63.39% $ 352,098.40 11.18% $ 105,812.00 $ 3,495.31 0.60% $ 23,545.26 4.06% 60.70% 18.24% $ 3,495.31 0.7% $ 22,455.45 4.3% $ 319,586.25 61.1% $ 80,702.62 15.4% 38 Other Income 0.00% 0.00% 0.00% 0.0% 39 Miscellaneous Gains/Losses $ 2,000.00 0.32% $ 0.00% $ 0.00% 0.00 0.0% 40 Total Other Income $ 2,000.00 0.32% $ 0.00% $ 0.00% $ 0.00 0.0% 41 Other Expenses 0.00% 0.00% 0.00% 0.0% 42 Other Miscellaneous Expense $ 0.00% $ 20,550.00 3.37% $ 29,050.00 5.01% 43 Total Other Expenses $ 0.00% $ 20,550.00 3.37% $ 29,050.00 5.01% 44 Net Other Income $ 2,000.00 0.32% $ (20,550.00) 45 Net Income (profit) $ 73,935.80 11.73% $ 47,704.07 -3.37% 7.81% $ (29,050.00) -5.01% $ 36,889.23 6.36% SSSS 0.0% - 0.0% 0.0% 80,702.62 15.4% 46
Step by Step Solution
There are 3 Steps involved in it

Get step-by-step solutions from verified subject matter experts