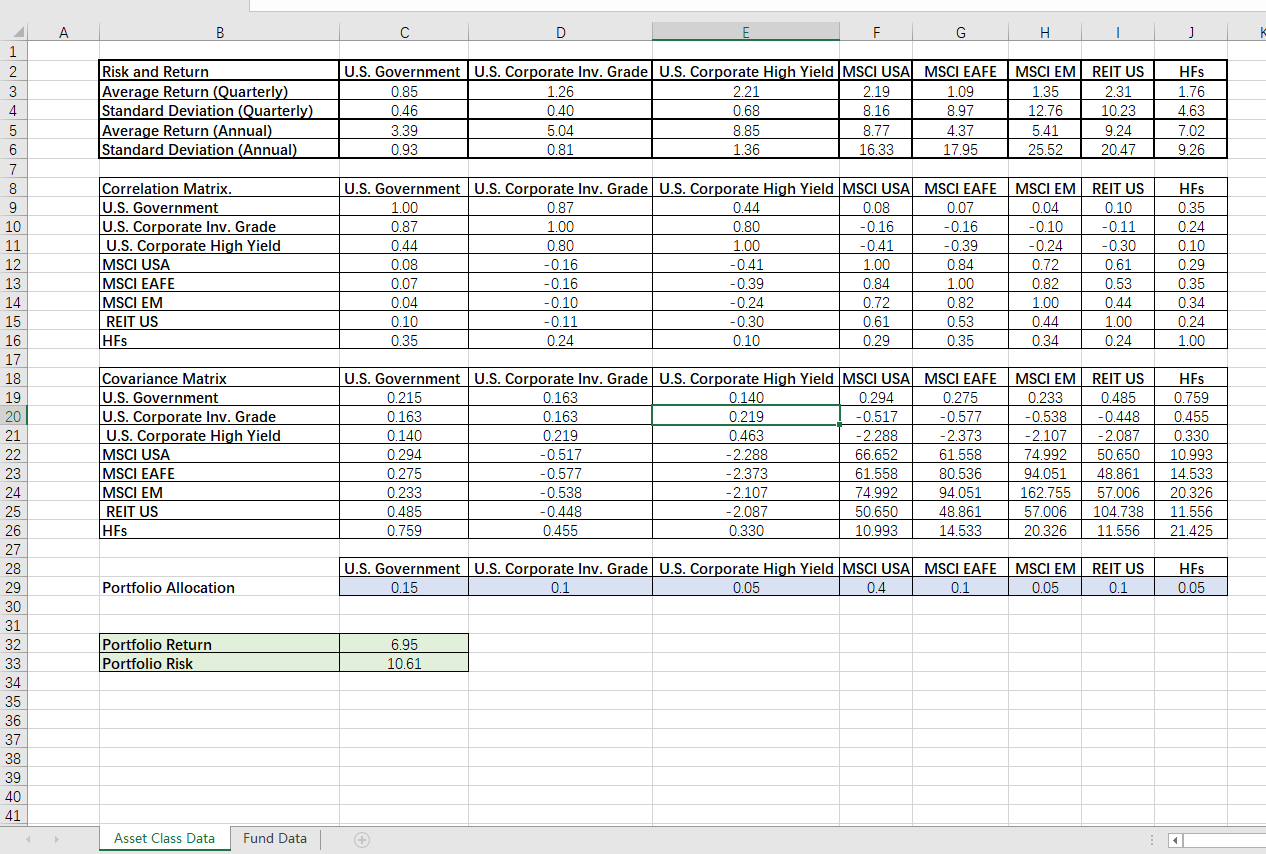
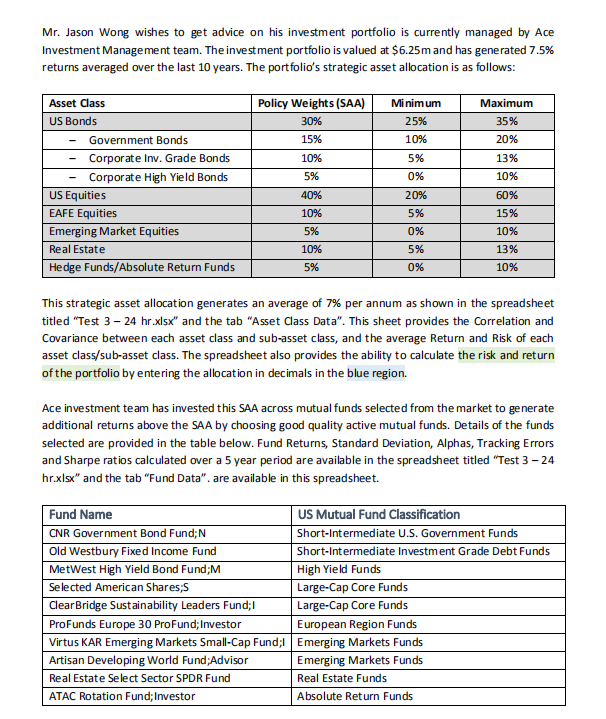
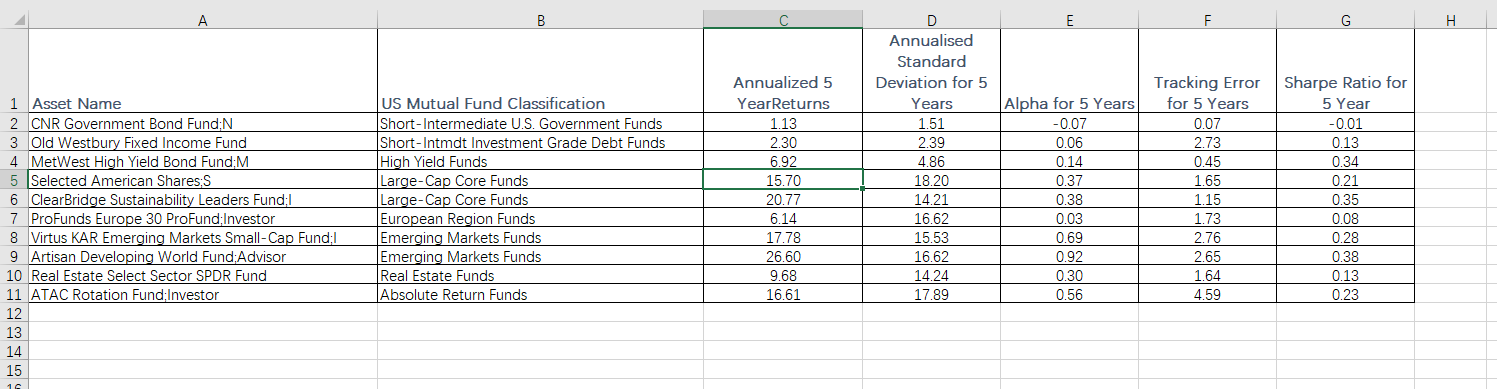
Question: A B C D E F G H Risk and Return U.S. Government|U.S. Corporate Inv. Grade |U.S. Corporate High Yield |MSCI USA MSCI EAFE |

A B C D E F G H Risk and Return U.S.A B C D E F G H Risk and Return U.S.A B C D E F G H Risk and Return U.S.
A B C D E F G H Risk and Return U.S. Government|U.S. Corporate Inv. Grade |U.S. Corporate High Yield |MSCI USA MSCI EAFE | MSCI EM|REIT US Average Return (Quarterly HFS 0.85 1.26 2.21 2.19 ..09 Standard Deviation (Quarterly 1.35 2.3. 1.76 0.46 0.40 0.6 8.16 8.97 12.76 Average Return (Annual) 10.23 1.63 3.39 5.04 8.85 8.77 1.37 Standard Deviation (Annual) 5.41 9.24 .02 0.93 0.81 1.36 16.33 17.95 25.52 20.47 9.26 Correlation Matrix. U.S. Government |U.S. Corporate Inv. Grade| U.S. Corporate High Yield |MSCI USA| MSCI EAFE U.S. Government MSCI EM | REIT US 1.00 HFS 0.87 0.44 10 U.S. Corporate Inv. Grade 0.08 0.07 0.04 0.10 0.87 1.00 0.35 0.80 11 -0.16 U.S. Corporate High Yield -0.16 0.10 0.44 0.11 0.24 0.80 1.00 12 MSCI USA .0.41 0.39 0.24 0.30 0.08 0.10 -0.16 13 -0.41 MSCI EAFE 1.00 0.84 0.72 0.61 0.07 0.16 0.29 -0.39 14 MSCI EM 0.84 0.04 1.00 0.82 0.53 0.35 0.10 0.24 15 REIT US 0.72 0.82 1.00 0.44 0.34 0.10 0.11 0.30 16 HFS 0.61 0.53 0.44 0.24 0.35 0.24 17 0.10 0.29 0.35 0.34 0.24 L.00 18 Covariance Matrix U.S. Government |U.S. Corporate Inv. Grade U.S. Corporate High Yield |MSCI USA MSCI EAFE MSCI EM | REIT US 19 U.S. Government HFS 0.21 .163 0.14 20 0.294 U.S. Corporate Inv. Grade 0.275 0.233 0.163 0.485 0.759 0.163 0.219 21 U.S. Corporate High Yield -0.517 -0.577 0.140 0.538 -0.448 0.455 0.219 0.463 22 MSCI USA 2.288 -2.373 -2.107 0.294 -2.087 0.330 0.517 2.288 23 66.652 MSCI EAFE 61.558 74.992 50.650 10.993 0.275 0.577 24 2.373 MSCI EM 61.558 0.233 80.536 94.051 48.861 14.533 0.538 25 2.107 REIT US 74.992 94.051 0.485 162.755 57.006 0.448 20.326 26 2.087 50.650 HFS 48.861 104.738 0.759 57.006 11.556 0.455 27 0.330 10.993 14.533 20.326 11.556 21.425 28 29 U.S. Government | U.S. Corporate Inv. Grade| U.S. Corporate High Yield |MSCI USA MSCI EAFE | MSCI EM| REIT US Portfolio Allocation 0.15 HFS 0.1 30 0.05 0.4 0.1 0.05 0.1 0.05 31 32 Portfolio Return 6.95 33 Portfolio Risk 10.61 34 35 36 37 38 39 40 41 Asset Class Data Fund Data +Mr. Jason Wong wishes to get advice on his investment portfolio is currently managed by Ace Investment Management team. The investment portfolio is valued at $6.25m and has generated 7.5% returns averaged over the last 10 years. The portfolio's strategic asset allocation is as follows: Asset Class Policy Weights (SAA) Minimum Maximum US Bonds 30% 25% 35% Government Bonds 15% 10% 20% Corporate Inv. Grade Bonds 10% 5% 13% Corporate High Yield Bonds 5% 0% 10% US Equities 40% 20% 50% EAFE Equities 10% 5% 15% Emerging Market Equities 5% 10% Real Estate 10% 13% Hedge Funds/ Absolute Return Funds 5% 0% 10% This strategic asset allocation generates an average of 7% per annum as shown in the spreadsheet titled "Test 3 - 24 hr.xlsx" and the tab "Asset Class Data". This sheet provides the Correlation and Covariance between each asset class and sub-asset class, and the average Return and Risk of each asset class/sub-asset class. The spreadsheet also provides the ability to calculate the risk and return of the portfolio by entering the allocation in decimals in the blue region. Ace investment team has invested this SAA across mutual funds selected from the market to generate additional returns above the SAA by choosing good quality active mutual funds. Details of the funds selected are provided in the table below. Fund Returns, Standard Deviation, Alphas, Tracking Errors and Sharpe ratios calculated over a 5 year period are available in the spreadsheet titled "Test 3 - 24 hr.xlsx" and the tab "Fund Data". are available in this spreadsheet. Fund Name US Mutual Fund Classification CNR Government Bond Fund; N Short-Intermediate U.S. Government Funds Old Westbury Fixed Income Fund Short-Intermediate Investment Grade Debt Funds MetWest High Yield Bond Fund;M High Yield Fund Selected American Shares;5 Large-Cap Core Funds Clear Bridge Sustainability Leaders Fund; I Large-Cap Core Funds ProFunds Europe 30 Profund; Investor European Region Funds Virtus KAR Emerging Markets Small-Cap Fund;I Emerging Markets Funds Artisan Developing World Fund;Advisor Emerging Markets Funds Real Estate Select Sector SPDR Fund Real Estate Funds ATAC Rotation Fund; Investor Absolute Return FundsA B C D F F G Annualised H Standard 1 Asset Name Annualized 5 Deviation for 5 US Mutual Fund Classification Tracking Error YearReturns Sharpe Ratio for CNR Government Bond Fund;N Years Short-Intermediate U.S. Government Funds Alpha for 5 Years for 5 Years 1AWN 1.13 1.51 5 Year Old Westbury Fixed Income Fund Short-Intmdt Investment Grade Debt Funds 0.07 0.07 MetWest High Yield Bond Fund;M 30 2.39 -0.01 High Yield Funds 0.06 73 5 Selected American Shares,S 6.92 Large-Cap Core Funds 1.86 0.13 0.14 0.45 6 ClearBridge Sustainability Leaders Fund; 15.70 0.34 Large-Cap Core Funds 18.20 0.37 20.77 1.65 14.21 0.21 7 ProFunds Europe 30 Profund; Investor European Region Funds 0.38 1.15 6.14 0.35 8 Virtus KAR Emerging Markets Small-Cap Fund;| Emerging Markets Funds 16.62 0.03 17.78 1.73 0.08 9 Artisan Developing World Fund; Advisor Emerging Markets Funds 15.53 0.69 2.76 16.62 0.28 10 Real Estate Select Sector SPDR Fund 26.60 Real Estate Funds 0.92 9.68 2.65 ).38 11 ATAC Rotation Fund Investor 14.24 Absolute Return Funds 0.30 1.64 12 16.61 0.13 17.89 0.56 4.59 0.23 13 14 15

Step by Step Solution

There are 3 Steps involved in it

1 Expert Approved Answer
Step: 1 Unlock blur-text-image
Question Has Been Solved by an Expert!

Get step-by-step solutions from verified subject matter experts

Step: 2 Unlock
Step: 3 Unlock

Students Have Also Explored These Related Finance Questions!