Question: A B C D E F G Key Check Figures N Schedules W Schedule B July August September Sched E15 4 Total collections $2,274,993 $2,572,479
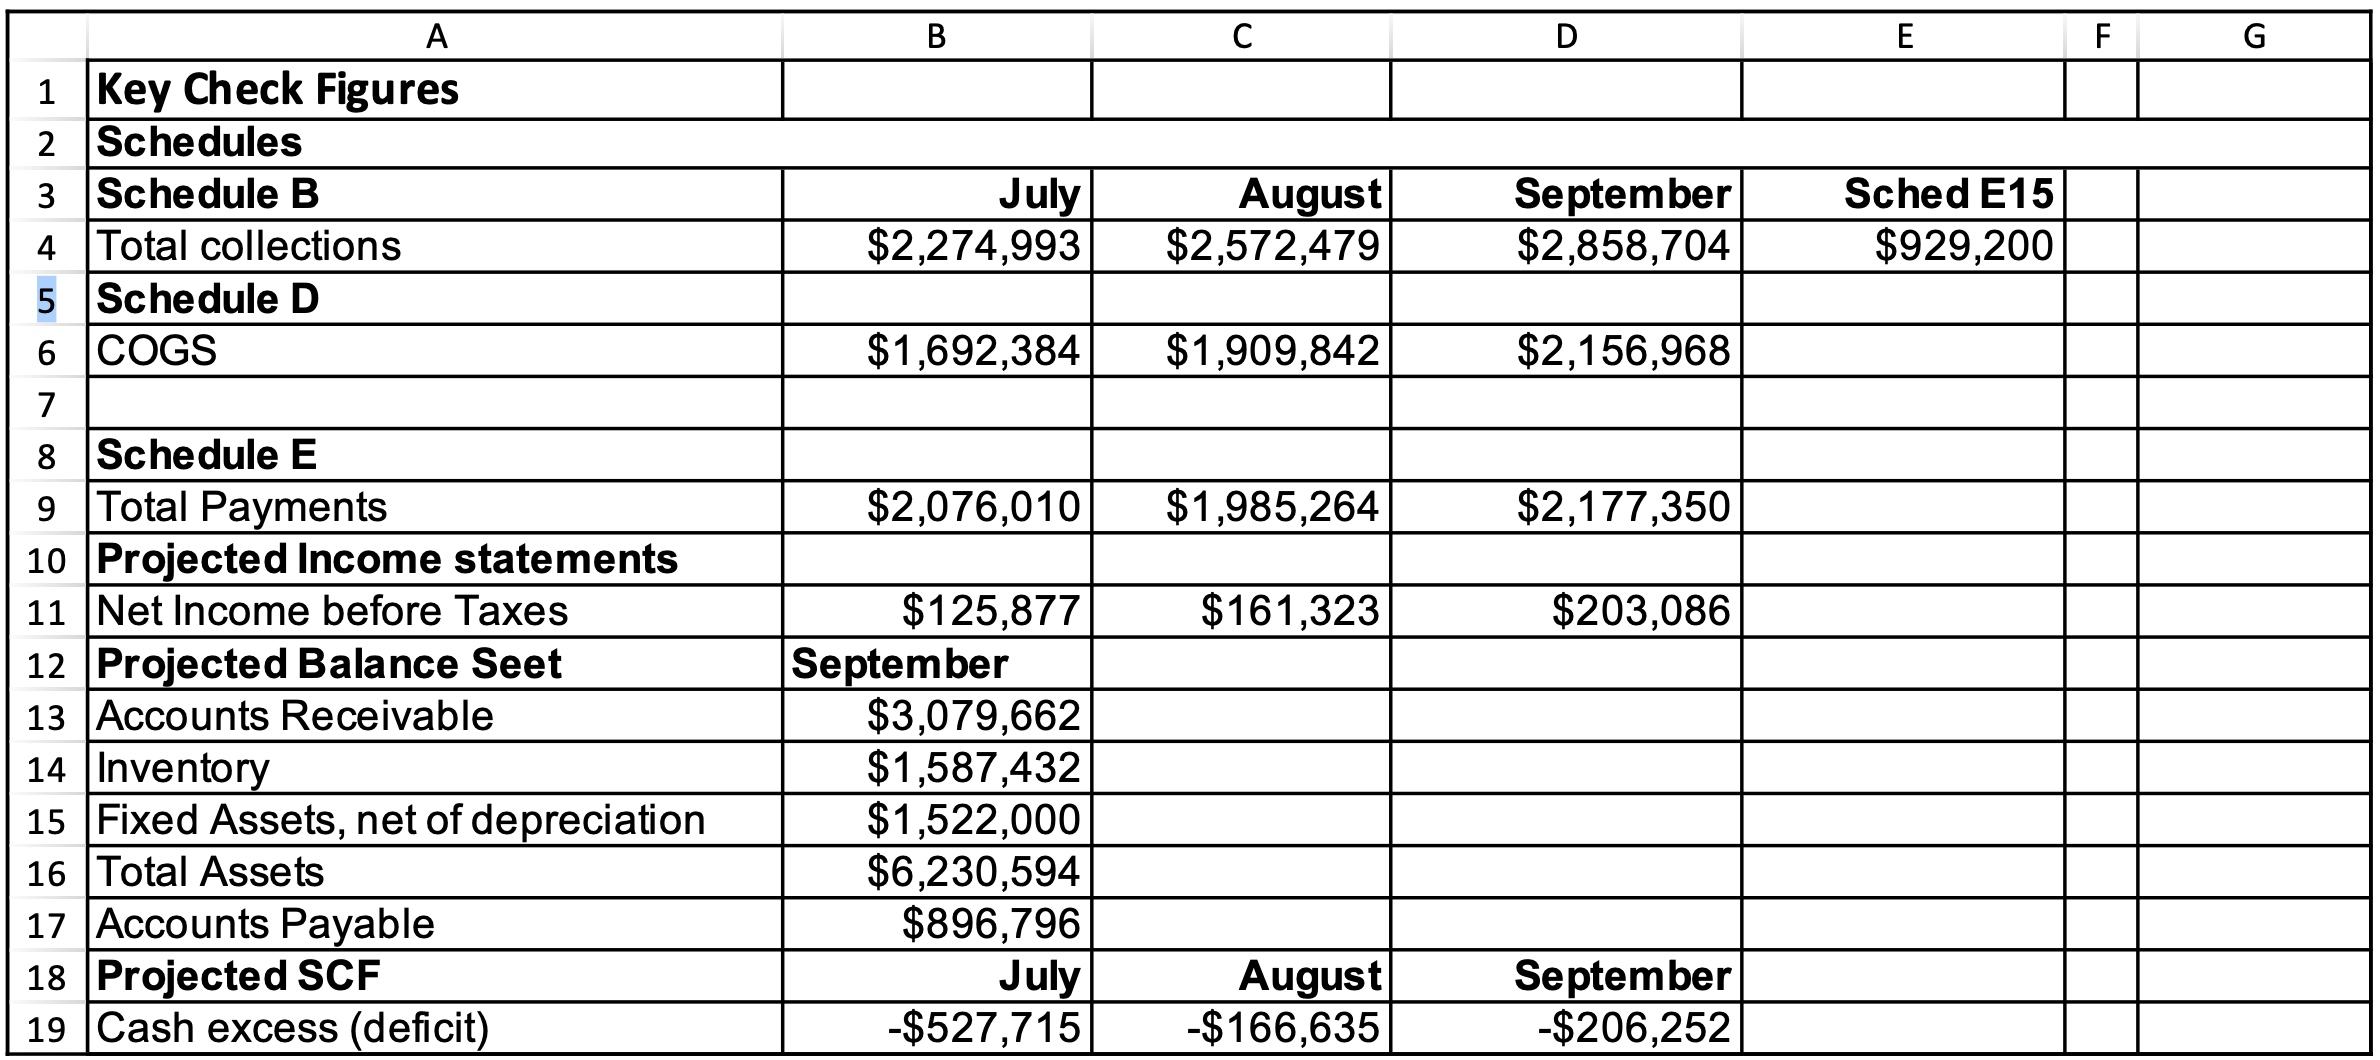
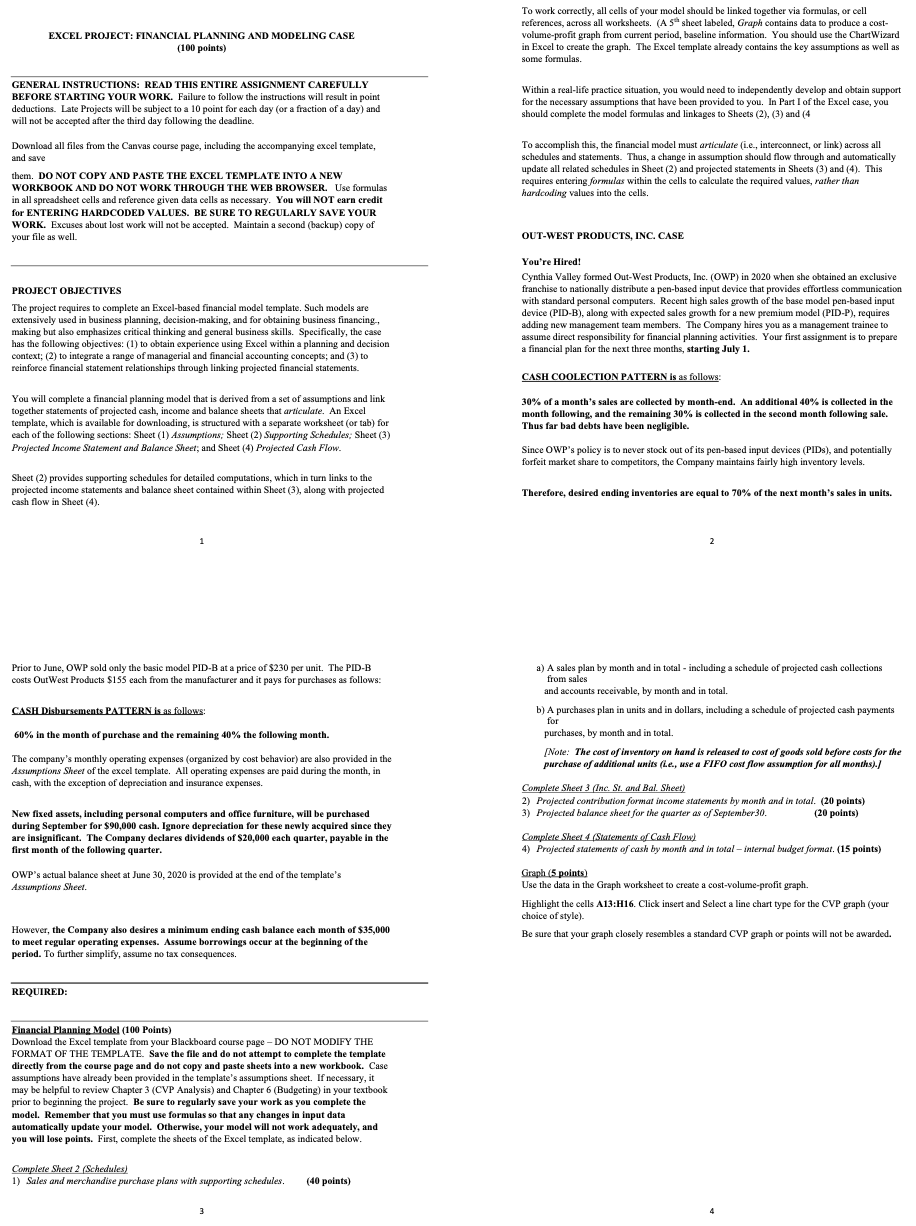
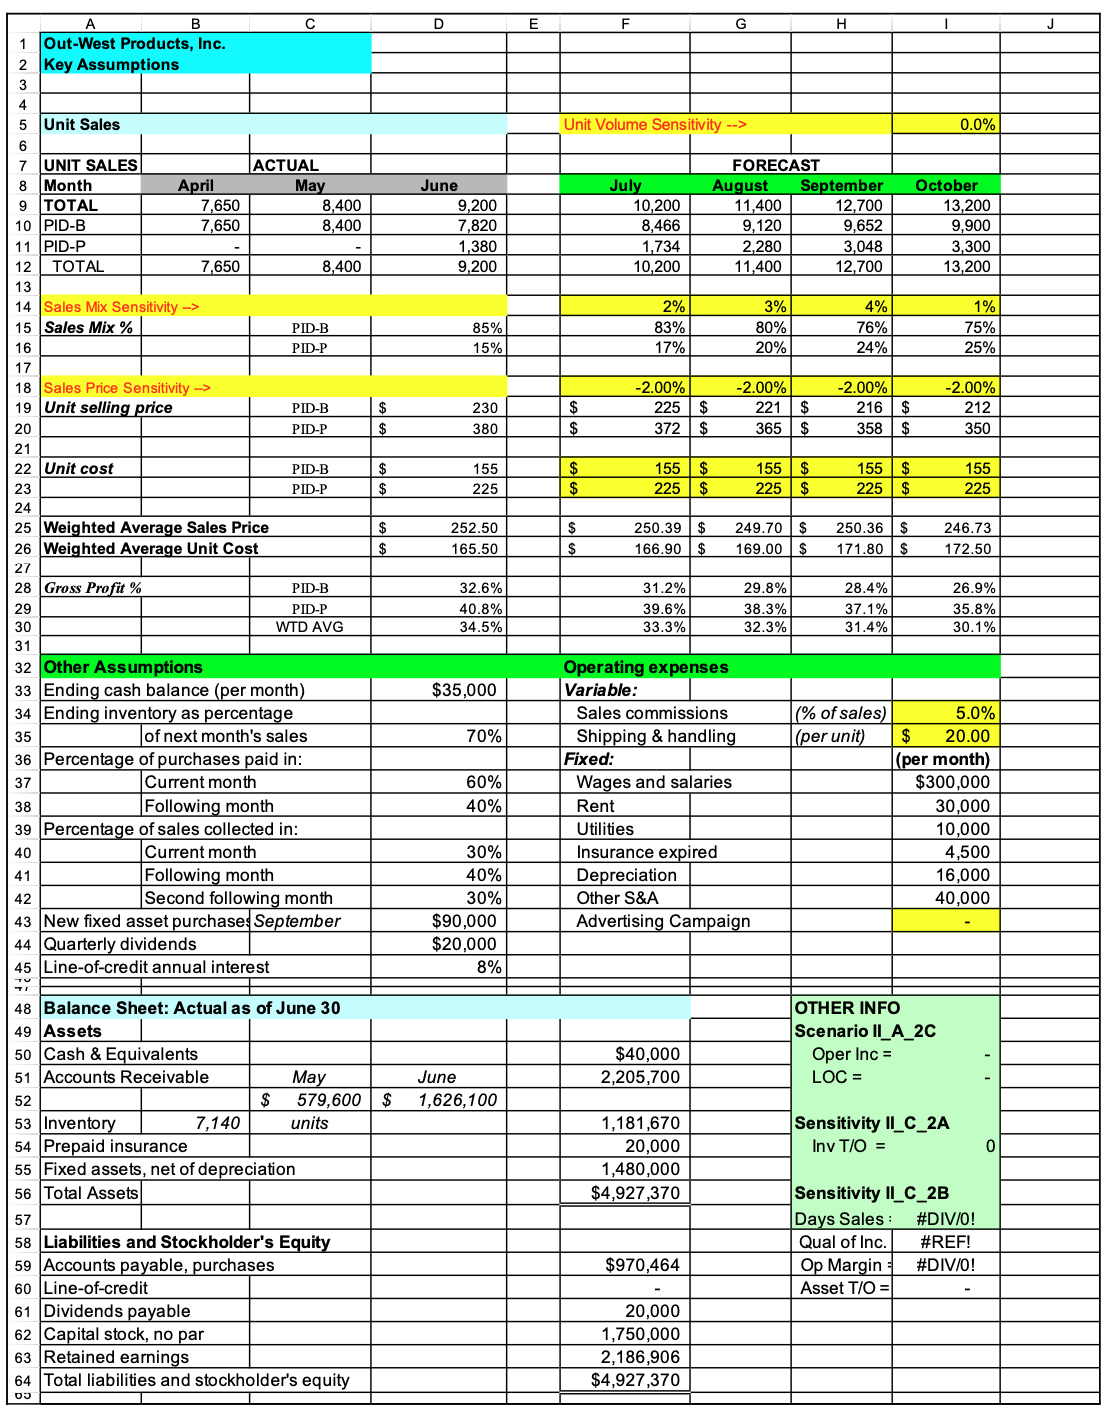
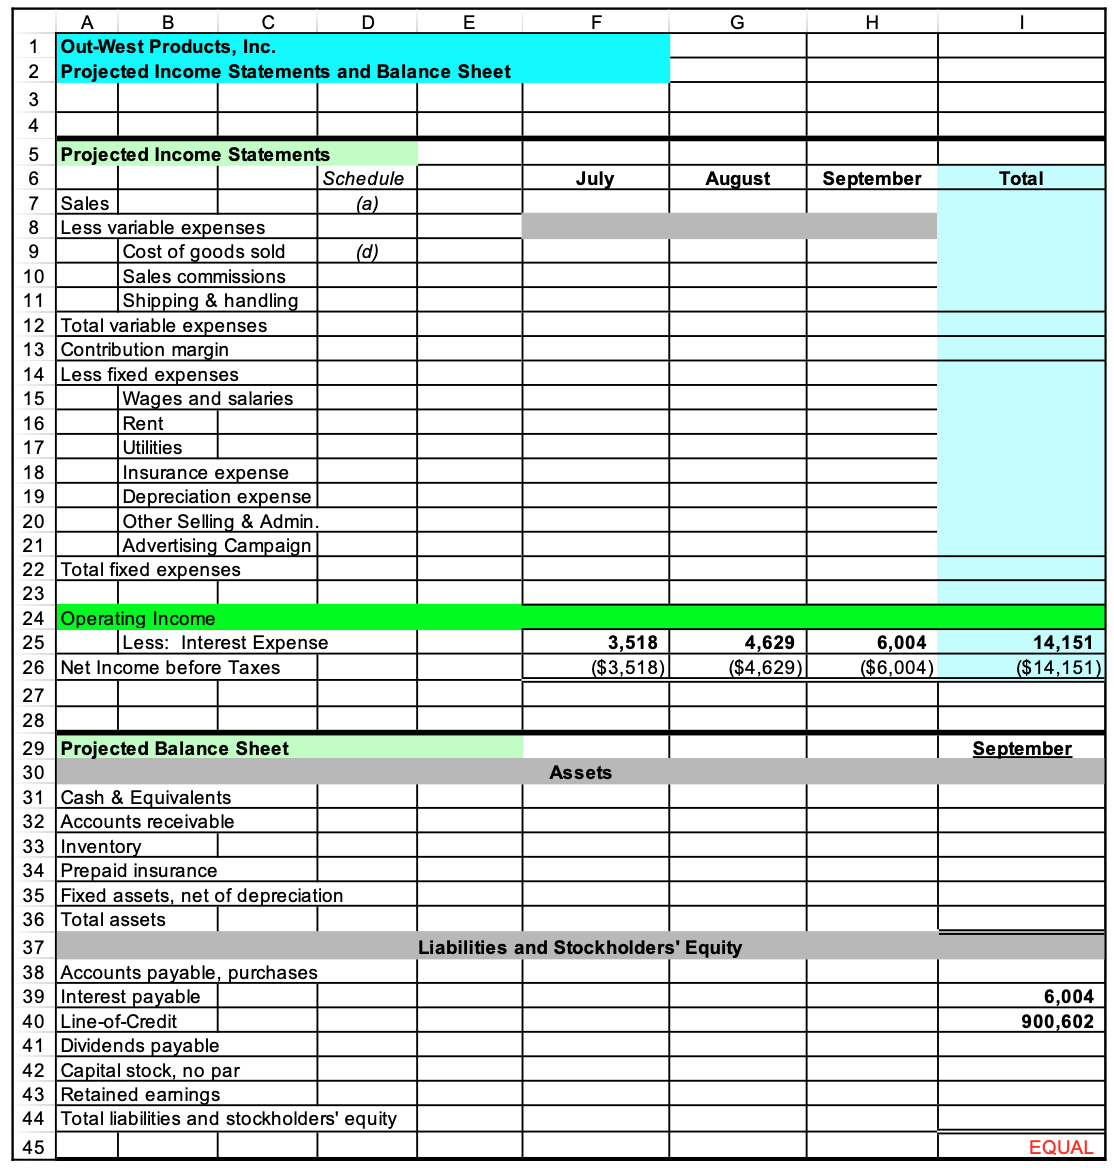
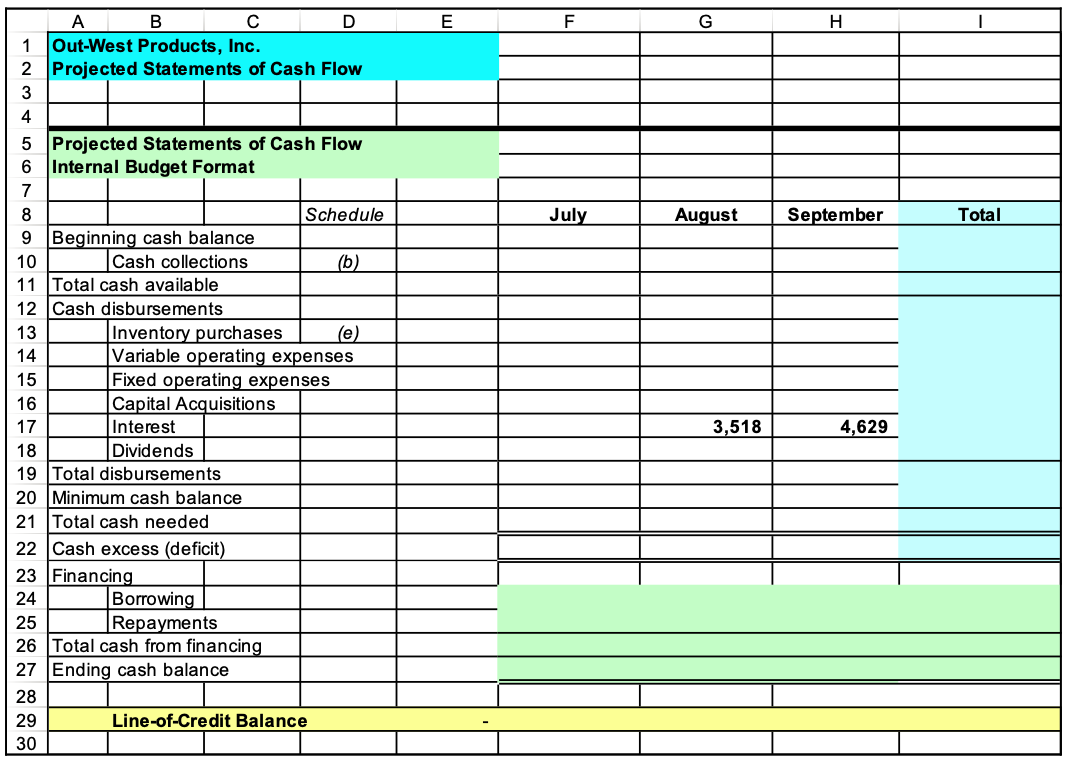
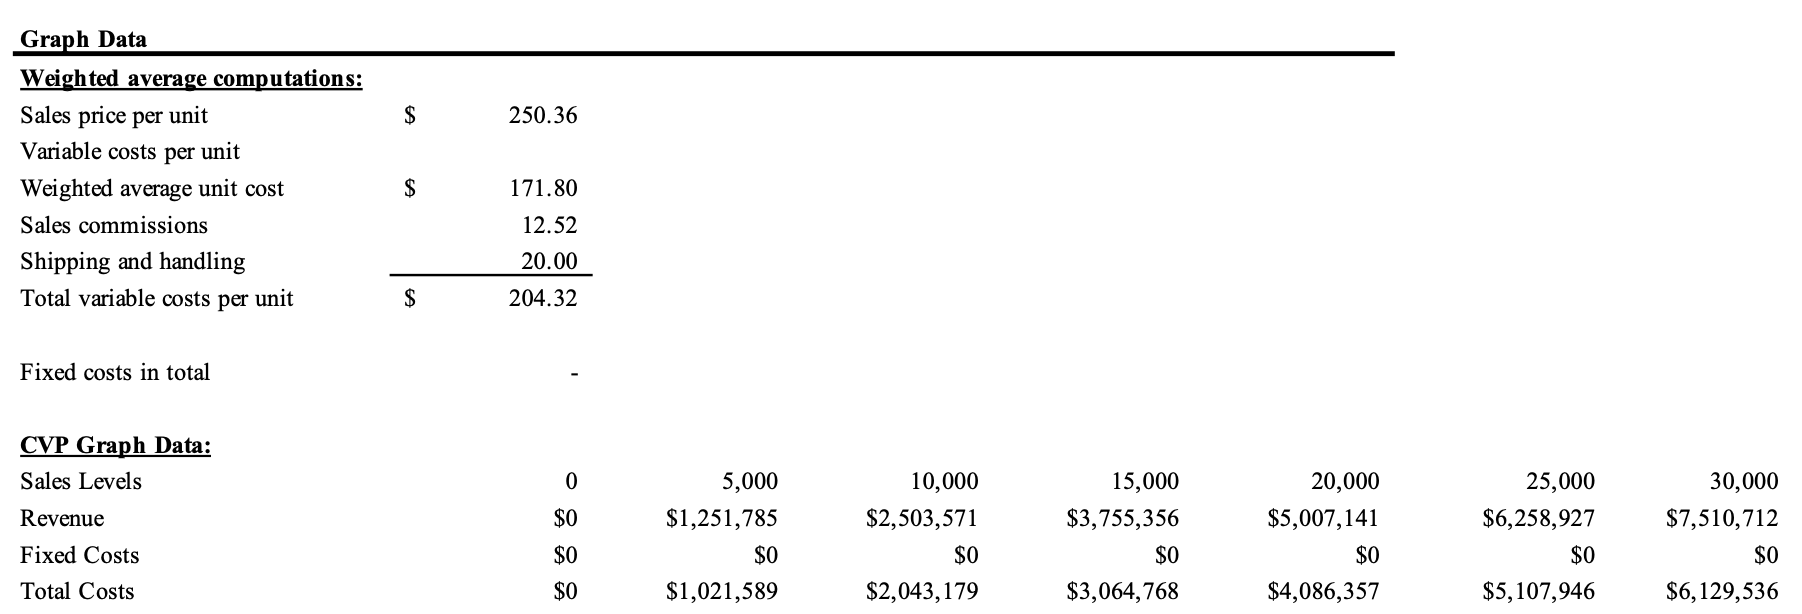
A B C D E F G Key Check Figures N Schedules W Schedule B July August September Sched E15 4 Total collections $2,274,993 $2,572,479 $2,858,704 $929,200 Schedule D COGS $1,692,384 $1,909,842 $2, 156,968 Schedule E Total Payments $2,076,010 $1,985,264 $2,177,350 10 Projected Income statements 11 Net Income before Taxes $125,877 $161,323 $203,086 12 Projected Balance Seet September 13 Accounts Receivable $3,079,662 14 Inventory $1,587,432 15 Fixed Assets, net of depreciation $1,522,000 16 Total Assets $6,230,594 17 Accounts Payable $896,796 18 Projected SCF July August September 19 Cash excess (deficit) -$527,715 -$166,635 -$206,252To work correctly, all cells of your model should be linked together via formulas, or cell references, across all worksheets. (A 5" sheet labeled, Graph contains data to produce a cost- EXCEL PROJECT: FINANCIAL PLANNING AND MODELING CASE volume-profit graph from current period, baseline information. You should use the ChartWizard (100 points) in Excel to create the graph. The Excel template already contains the key assumptions as well as some formulas. GENERAL INSTRUCTIONS: READ THIS ENTIRE ASSIGNMENT CAREFULLY BEFORE STARTING YOUR WORK. Failure to follow the instructions will result in point Within a real-life practice situation, you would need to independently develop and obtain support deductions. Late Projects will be subject to a 10 point for each day (or a fraction of a day) and for the necessary assumptions that have been provided to you. In Part I of the Excel case, you will not be accepted after the third day following the deadline. should complete the model formulas an es to Sheets (2), (3) and (4 Download all files from the Canvas course page, including the accompanying excel template, To accomplish this, the financial model must articulate (i.e., interconnect, or link) across all and save schedules and statements. Thus, a change in assumption should flow through and automatically them. DO NOT COPY AND PASTE THE EXCEL TEMPLATE INTO A NEW update all related schedules in Sheet (2) and projected statements in Sheets (3) and (4). This WORKBOOK AND DO NOT WORK THROUGH THE WEB BROWSER. Use formulas requires entering formulas within the cells to calculate the required values, rather than in all spreadsheet cells and reference given data cells as necessary. You will NOT earn credit hardcoding values into the cells. for ENTERING HARDCODED VALUES. BE SURE TO REGULARLY SAVE YOUR WORK. Excuses about lost work will not be accepted. Maintain a second (backup) copy of your file as well. OUT-WEST PRODUCTS, INC. CASE You're Hired Cynthia Valley formed Out-West Products, Inc. (OWP) in 2020 when she obtained an exclusive PROJECT OBJECTIVES franchise to nationally distribute a pen-based input device that provides effortless communication The project requires to complete an Excel-based financial model template. Such models are with standard personal computers. Recent high sales growth of the base model pen-based input extensively used in business planning, decision-making, and for obtaining business financing, device (PID-B), along with expected sales growth for a new premium model (PID-P), requires making but also emphasizes critical thinking and general business skills. Specifically, the case adding new management team members. The Company hires you as a management trainee to has the following objectives: (1) to obtain experience using Excel within a planning and decision assume direct responsibility for financial planning activities. Your first assignment is to prepare context; (2) to integrate a range of managerial and financial accounting concepts; and (3) to a financial plan for the next three months, starting July 1. reinforce financial statement relationships through linking projected financial statements. CASH COOLECTION PATTERN is as follows: You will complete a financial planning model that is derived from a set of assumptions and link 30% of a month's sales are collected by month-end. An additional 40% is collected in the together statements of projected cash, income and balance sheets that articulate. An Excel month following, and the remaining 30% is collected in the second month following sale. template, which is available for downloading, is structured with a separate worksheet (or tab) for Thus far bad debts have been negligible. each of the following sections: Sheet (1) Assumptions; Sheet (2) Supporting Schedules; Sheet (3) Projected Income Statement and Balance Sheet; and Sheet (4) Projected Cash Flow. Since OWP's policy is to never stock out of its pen-based input devices (PIDs), and potentially forfeit market share to competitors, the Company maintains fairly high inventory levels. Sheet (2) provides supporting schedules for detailed computations, which in turn links to the projected income statements and balance sheet contained within Sheet (3), along with projected Therefore, desired ending inventories are equal to 70% of the next month's sales in units. cash flow in Sheet (4). Prior to June, OWP sold only the basic model PID-B at a price of $230 per unit. The PID-B a) A sales plan by month and in total - including a schedule of projected cash collections costs OutWest Products $155 each from the manufacturer and it pays for purchases as follows: from sales and accounts receivable, by month and in total. CASH Disbursements PATTERN is as follows: b) A purchases plan in units and in dollars, including a schedule of projected cash payments for 60% in the month of purchase and the remaining 40% the following month. purchases, by month and in total. The company's monthly operating expenses (organized by cost behavior) are also provided in the Note: The cost of inventory on hand is released to cost of goods sold before costs for the Assumptions Sheet of the excel template. All operating expenses are paid during the month, in purchase of additional units (Le., use a FIFO cost flow assumption for all months).] cash, with the exception of depreciation and insurance expenses. Complete Sheet 3 (Inc. Si. and Bal. Sheet 2) Projected contribution formal income statements by month and in total. (20 points) New fixed assets, including personal computers and office furniture, will be purchased 3) Projected balance sheet for the quarter as of September30. (20 points) during September for $90,000 cash. Ignore depreciation for these newly acquired since they are insignificant. The Company declares dividends of $20,000 each quarter, payable in the Complete Sheet 4 (Statements of Cash Flow) first month of the following quarter. 4) Projected statements of cash by month and in total - internal budget format. (15 points) OWP's actual balance sheet at June 30, 2020 is provided at the end of the template's Graph (5 points) Assumptions Sheet. Use the data in the Graph worksheet to create a cost-volume-profit graph. Highlight the cells A13:H16. Click insert and Select a line chart type for the CVP graph (your choice of style). However, the Company also desires a minimum ending cash balance each month of $35,000 Be sure that your graph closely resembles a standard CVP graph or points will not be awarded. to meet regular operating expenses. Assume borrowings occur at the beginning of the period. To further simplify, assume no tax consequences. REQUIRED: Financial Planning Model (100 Points) Download the Excel template from your Blackboard course page - DO NOT MODIFY THE FORMAT OF THE TEMPLATE. Save the file and do not attempt to complete the template directly from the course page and do not copy and paste sheets into a new workbook. Case assumptions have already been provided in the template's assumptions sheet. If necessary, it may be helpful to review Chapter 3 (CVP Analysis) and Chapter 6 (Budgeting) in your textbook prior to beginning the project. Be sure to regularly save your work as you complete the model. Remember that you must use formulas so that any changes in input data automatically update your model. Otherwise, your model will not work adequately, and you will lose points. First, complete the sheets of the Excel template, as indicated below. Complete Sheet 2 (Schedules) 1)Sales and merchandise purchase plans with supporting schedules. (40 points)A B C D G Out-West Products, Inc. Key Assumptions DAWN Unit Sales Unit Volume Sensitivity --> 0.0% 7 UNIT SALES ACTUAL FORECAST 8 Month April May June July August September October 9 TOTAL 7,650 8,400 9,200 10,200 11,400 12,700 13,200 10 PID-B 7,650 8,400 7,820 8,466 9,12 9,652 9,900 11 PID-P 1,380 1,734 2,280 3,048 3,300 12 TOTAL 7,650 8,400 9,200 10,200 11,400 12,700 13,200 14 Sales Mix Sensitivity -> 2% 3% 4% 1% Sales Mix % PID-E 85% 83% 80% 76% 75% PID-P 15% 17% 20% 24% 25% 18 Sales Price Sensitivity -> 2.00% -2.00% 2.00% 2.00% 19 Unit selling price PID-B 230 225 $ 221 $ 216 $ 212 20 PID-P 380 372 $ 365 $ 358 $ 350 21 22 Unit cost PID-B 155 155 $ 155 9 155 $ 155 CA CA 23 PID-F 225 225 $ 225 $ 225 $ 225 24 25 Weighted Average Sales Price 252.50 250.39 $ 249.70 $ 250.36 $ 246.73 26 Weighted Average Unit Cost 65.50 66.90 $ 169.00 $ 171.80 $ 172.50 27 28 Gross Profit PID-E 32.6% 31.2% 29.8% 28.4% 26.9% 29 PID-P 40.8 39.6% 38.3% 37.1% 35.8% 30 WTD AVG $4.5% 33.3% 32.3% 31.4% 30.1% 31 32 Other Assumptions Operating expenses 33 Ending cash balance (per month) $35,000 Variable: 34 Ending inventory as percentage Sales commissions (% of sales) 5.0% 35 of next month's sales 70% Shipping & handling per unit $ 20.00 36 Percentage of purchases paid in: Fixed: (per month) 37 Current month 60% Wages and salaries $300,000 38 Following month 40% Rent 30,000 39 Percentage of sales collected in: Utilities 10,000 40 Current month 30% Insurance expired 4,500 41 Following month 0% Depreciation 16,000 42 Second following month 0% Other S&A 40,000 43 New fixed asset purchases September $90,000 Advertising Campaign 44 Quarterly dividends $20.000 45 Line-of-credit annual interest 8% 48 Balance Sheet: Actual as of June 30 OTHER INFO 49 Assets Scenario II_A_2C 50 Cash & Equivalents $40,000 Oper Inc = 51 Accounts Receivable May June 2,205,700 LOC = 52 $ 579,600 $ 1,626,100 53 Inventory 7,140 units 1, 181,670 Sensitivity II_C_2A 54 Prepaid insurance 20,000 Inv T/O = 0 55 Fixed assets, net of depreciation 1,480,000 56 Total Assets $4,927,370 Sensitivity II_C_2B 57 Days Sales : #DIV/O! 58 Liabilities and Stockholder's Equity Qual of Inc. #REF! 59 Accounts payable, purchases $970,464 Op Margin #DIV/O! 60 Line-of-credit Asset T/O = 61 Dividends payable 20,000 62 Capital stock, no par 1,750,000 63 Retained earnings 2,186,906 4 Total liabilities and stockholder's equity $4,927,370A B C D E F G H Out-West Products, Inc. Detailed Operating Schedules AWN - Schedule a: Sales plan July August September Total Weighted average sales price Total Units 16 00 Credit sales, 100% 10 11 12 NOTE: Actual A/R should be collected in July and Aug. 13 Schedule b: Cash collections 14 From current month's sales 15 From sales 1 month before 16 From sales 2 months before 17 Total collections |Schedule c: Purchases plan in units 22 Desired units in ending inventory 23 Plus units sold 24 Total needed 25 Less beginning inventory Required purchases |Schedule d: Purchases plan (dollars) 31 Weighted average unit cost 32 33 Desired ending inventory 34 Plus cost of goods sold 35 Total requirements 6 Less beginning inventory 37 Total purchases 38 39 0 Note: Actual A/P should be paid in July only Schedule e: Cash pmts for purchases 42 From accounts payable (6/30) 43 From July Purchases 44 From August Purchases 45 From September Purchases 46 Total payments 47A B C D E F G H Out-West Products, Inc. IN Projected Income Statements and Balance Sheet Projected Income Statements Schedule July August September Total Sales (a Less variable expenses CO Cost of goods sold (d) 10 Sales commissions 11 Shipping & handling 12 Total variable expenses 13 Contribution margin 14 Less fixed expenses 15 Wages and salaries 16 Rent 17 Utilities 18 Insurance expense 19 Depreciation expense 20 Other Selling & Admin 21 Advertising Campaign 22 Total fixed expenses 23 24 Operating Income 25 Less: Interest Expense 3,518 4,629 6,004 14,151 26 Net Income before Taxes $3,518) ($4,629) ($6,004 ($14, 151) 27 28 29 Projected Balance Sheet September 30 Assets 31 Cash & Equivalents 32 Accounts receivable 33 Inventory 34 Prepaid insurance 35 Fixed assets, net of depreciation 36 Total assets 37 Liabilities and Stockholders' Equity 38 Accounts payable, purchases 39 Interest payable 6,004 0 Line-of-Credit 900,602 41 Dividends payable 42 Capital stock, no par 3 Retained earnings 44 Total liabilities and stockholders' equity 45 EQUALA B C D E F G H Out-West Products, Inc. Projected Statements of Cash Flow AWN. Projected Statements of Cash Flow Internal Budget Format Schedule July August September Total Beginning cash balance 10 Cash collections (b) 11 Total cash available 12 Cash disbursements 13 Inventory purchases (e) 14 Variable operating expenses 15 Fixed operating expenses 16 Capital Acquisitions 17 Interest 3,518 4,629 18 Dividends 19 Total disbursements 20 Minimum cash balance 21 Total cash needed 22 Cash excess (deficit) 23 Financing 24 Borrowing 25 Repayments 26 Total cash from financing 27 Ending cash balance 28 29 Line-of-Credit Balance 30Graph Data Weighted average computations: Sales price per unit Variable costs per unit Weighted average unit cost Sales commissions Shipping and handling Total variable costs per unit Fixed costs in total CVP Graph Data: Sales Levels Revenue Fixed Costs Total Costs $ 250.36 171.80 12.52 20.00 204.32 $0 $0 5,000 $1,251,785 $0 $1,021,589 10,000 $2,503,571 $0 $2,043,179 15,000 $3,755,356 $0 $3,064,768 20,000 $5,007,141 $0 $4,086,357 25,000 $6,258,927 $0 $5,107,946 30,000 $7,510,712 $0 $6,129,536
Step by Step Solution
There are 3 Steps involved in it
1 Expert Approved Answer
Step: 1 Unlock
Question Has Been Solved by an Expert!
Get step-by-step solutions from verified subject matter experts
Step: 2 Unlock
Step: 3 Unlock
Students Have Also Explored These Related Accounting Questions!